
One row is one stretch of flying
A sail wears out by the hour, and hours are only accurate if they count themselves. The unit the platform counts is one interval a sail was flying: this sail, up at this instant, down at that one. Total hours, hoist counts, the wind a sail saw and how it has performed over its life are all computed from that one shape.
The rows fill themselves as the crew taps sails up, down and away on the SAILS tab in Race Control. What each tap sends is not the change — it is the complete set flying at that instant, with the empty set meaning everything is down. That choice is about a boat with a marginal signal behind a hill: a stream of changes only reconstructs the truth if every event arrives, in order, exactly once, and one missed event would leave the ledger wrong from that moment to the end of the day with nothing downstream able to tell.
- A dropped event costs one boundary, not the rest of the day. The next tap that arrives re-establishes the whole truth.
- An undo is the previous set, sent again. No special case, no compensating event.
- A sail change is one atomic instant. Swapping one kite for another never passes through a state in which two spinnakers were flying, which separate up and down events would.
Runs, not pairs
Given a day of those snapshots, a sail’s intervals are the maximal runs of consecutive snapshots that contain it. Walking the day in order, each snapshot closes every open interval whose sail is not in this set and opens one for each sail in the set that is not already open.
A sail that is still up stays up — it does not come down and go back up again.
That last clause is the whole design, because hoist count means hoists. Tap the same set three times in half an hour — a re-confirmation, a correction to something else in it, a tap while checking the screen — and pairing events naively gives three hoists of the main, two of them zero minutes long. Runs give one hoist of thirty minutes, which is what happened. A sail that does come down and go back up is a second hoist, because the run broke.
Nothing closes an interval for you. A sail still up at the last snapshot of the day stays open indefinitely, because the platform cannot tell a sail still flying from a tablet that went flat — and a guessed down-time would enter the season’s totals as if it had been measured. An open interval is shown, flagged, and counted toward nothing until a person supplies the missing half.
Corrections win. A row the app recorded is recomputed on every new tap; a row you edited or typed in is left alone, and a typed row hides any recorded interval of the same sail it overlaps. A recorded row cannot be deleted — the next tap would re-derive it — so the log offers void instead, which is durable: struck out of every total, still listed, and surviving re-derivation.
The wind those hours were flown in
Twenty hours in ten knots is a different life from twenty hours in twenty-five, so each sail’s log answers in wind. For each second of flying time the platform takes the true wind speed from the per-second summary: one second, one number. The median of those is the typical breeze, and the same values are grouped into bands two knots wide — lower bound included, upper excluded, so 10.0 knots belongs to the 10–12 band and never to 8–10 — with the top band left open.
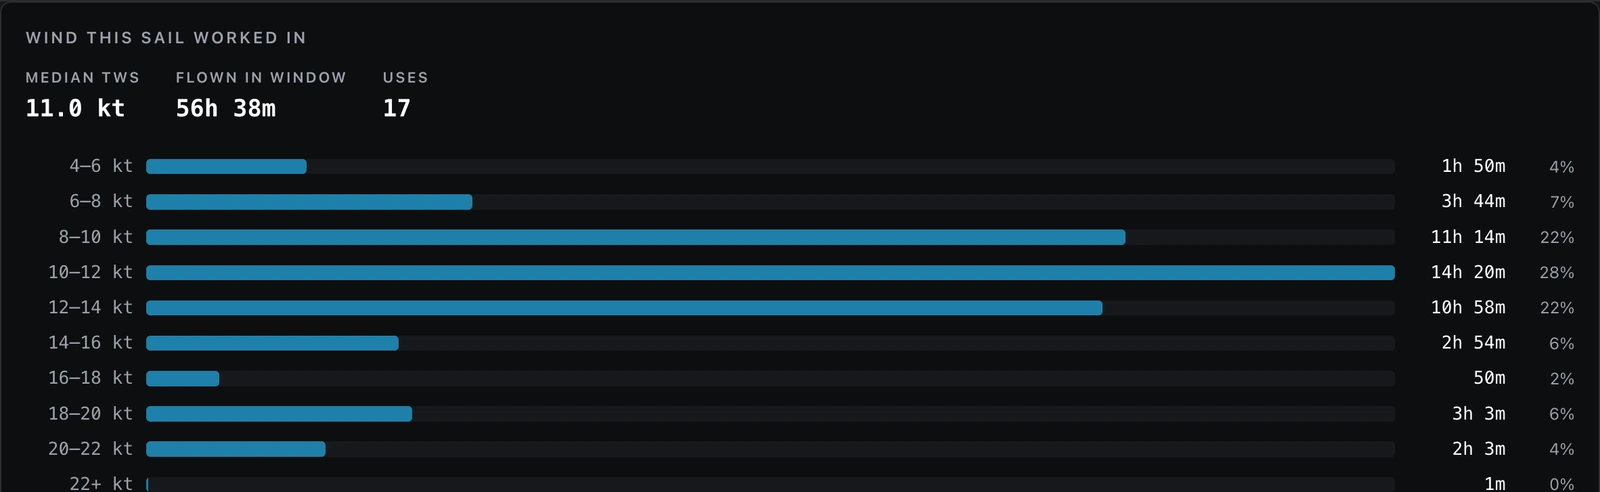
A median rather than a mean, because one squall should not move the answer for a season and one minute of a broken instrument reading 90 knots should move it not at all. Two numbers are reported and never one: total minutes is the sail’s life and sampled minutes is how much of it had wind data behind it. Sails go up on deliveries and practice days when nobody is logging telemetry, and one number would mean either overstating the evidence or understating the sail.
Why a comparison carries an interval
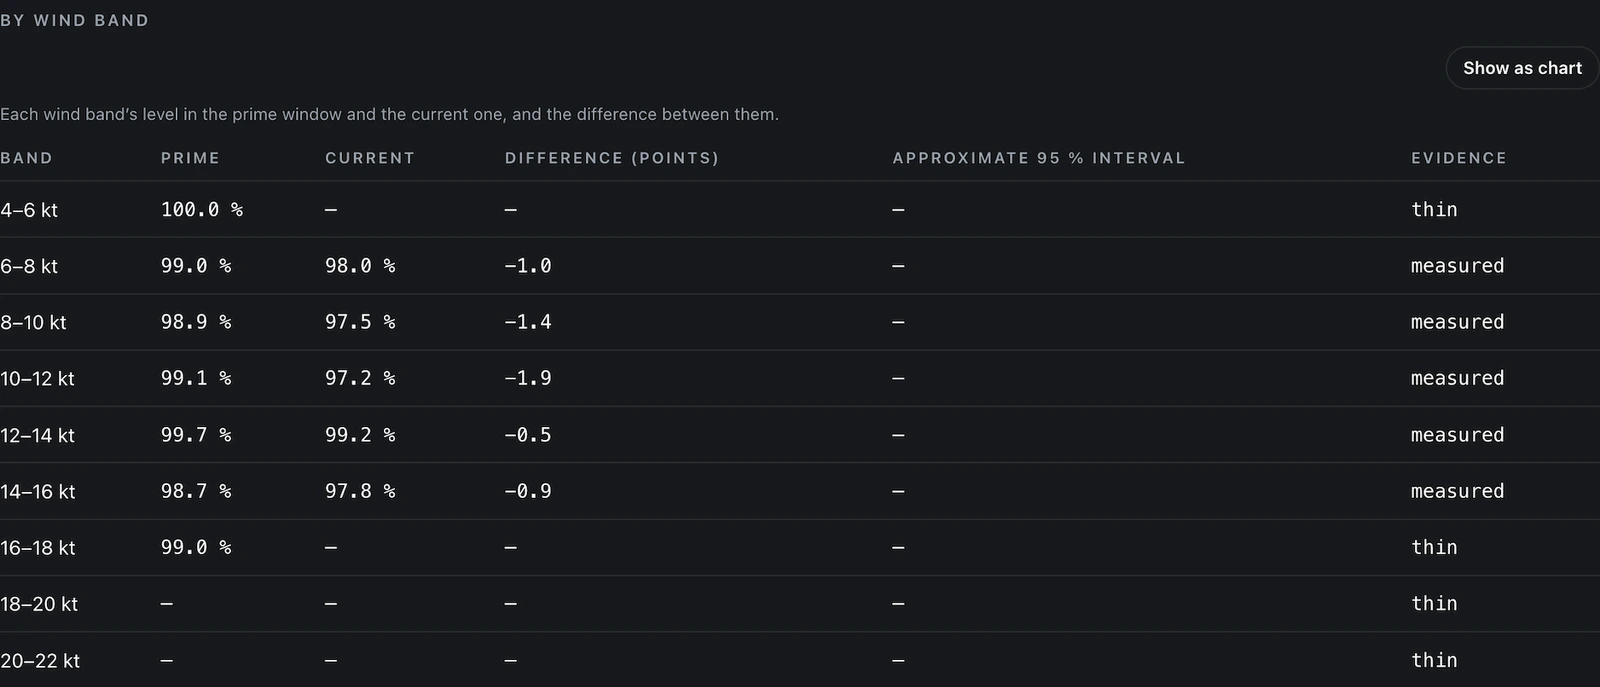
The harder question is whether a sail has slowed down, and the answer is never a single number. The sail is compared with itself: prime is its earliest sailing and current its latest, each at least ten flying hours and five sailing days, never overlapping. What is compared is the speed the boat made good toward or away from the wind against the best its own polar says it could have made at that wind speed, so the number falls whether the sail is slower or the boat is sailing lower.
The difference between the two windows carries an approximate 95 % interval from a day-clustered bootstrap: whole sailing days are resampled with replacement and the difference recomputed each time. Days rather than segments, because two segments from one afternoon are not two independent measurements of a sail — they are two measurements of one afternoon, and treating them as independent would report a difference as certain on the strength of one windy Saturday.
The word is read from the interval and from nothing else. There is no threshold behind those four and no fifth word: four points with an interval from −9 to +1 reads no detectable change, and 0.4 points with an interval from −0.7 to −0.1 reads down.
Two sails on the days they both flew
A mainsail that is up all day cannot be told apart from the day it sailed in. So beside every band the platform makes the same comparison over every sail that flew that band, and where this sail’s difference sits inside that one the row reads indistinguishable from the boat’s own drift — the change is reported as the boat’s and is not charged to the sail.
The comparison that settles that case is two sails on the days they both flew. Take the days both were up in the same band, compare them day by day, and whatever made the whole boat fast or slow that day — the sea state, the crew, the rig, the calibration in force — is the same for both and subtracts out.
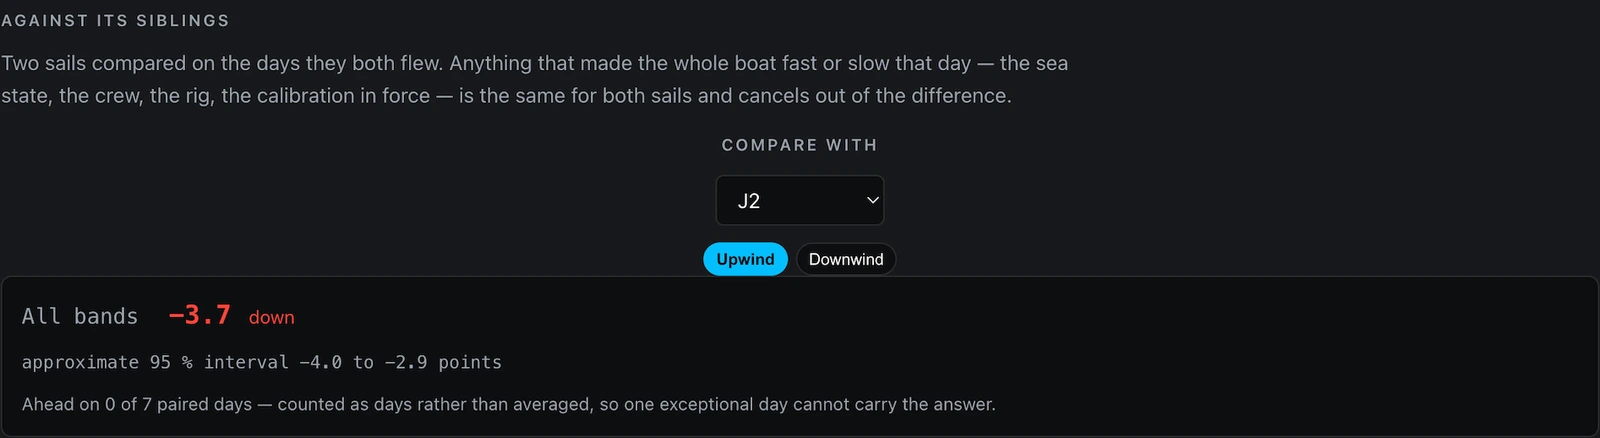
It needs crossover days, and alternating the two sails across one day is what fills it in. What does not cancel is drift within a day: if one flew the morning and the other the afternoon, the difference carries whatever changed between them.
Where the page lives
Open Boats and take Sails from the boat’s row, beside Polar, Targets and Calibration: the wardrobe, the usage log and each sail’s journal. Open the full analysis on a sail’s panel opens a page for that one sail, with its own address, so it can be sent to a sailmaker with everything needed to weigh the numbers on the same screen. The method is written out in Measuring sail degradation, down to the sixteen limits it carries.
Read the method
The documentation this post draws on.
- The sail log — How minutes per sail compute themselves from snapshots, why a missed tap costs one boundary rather than a day, and what the performance trend does and does not claim.
- Measuring sail degradation — Whether a sail has slowed down, and how sure the platform is: VMG against the polar’s best VMG rather than boat speed alone, steady segments conditioned by mode and wind band, day-clustered bootstrap intervals, two sails compared on the same day, and the sixteen limits the method carries.
- The sails log — Setting up the wardrobe, letting the tablet fill the log, typing in what it did not record, correcting rows, and reading the two analysis panels.