
Ashore and on board
Navigation
Draw the course ashore with the forecast and the depth on the chart, route it with the engine the tablet runs at sea, and load it on the boat with no signal.
Who it is for
The navigator, and the tactician on a windward-leeward day. For a coastal or offshore race the job is to plan it in a browser — the course, the forecast, the depth and the routed path — and then sail it on the boat with no signal, on a tablet holding the same plan and running the same routing engine. For a windward-leeward race the marks live in the same library, and the tablet sets the course on the water, pings both ends of the line and runs the start, with laylines and targets from the boat’s own instruments.
Race plans
A plan is a document: waypoints in order, which side to leave each one, a passing radius, the water the routing must not enter, and the depth you want under the keel. The committee’s GPX imports into a plan, and a plan exports as GPX for a plotter. Every boat’s plans are listed together on the Navigation page.
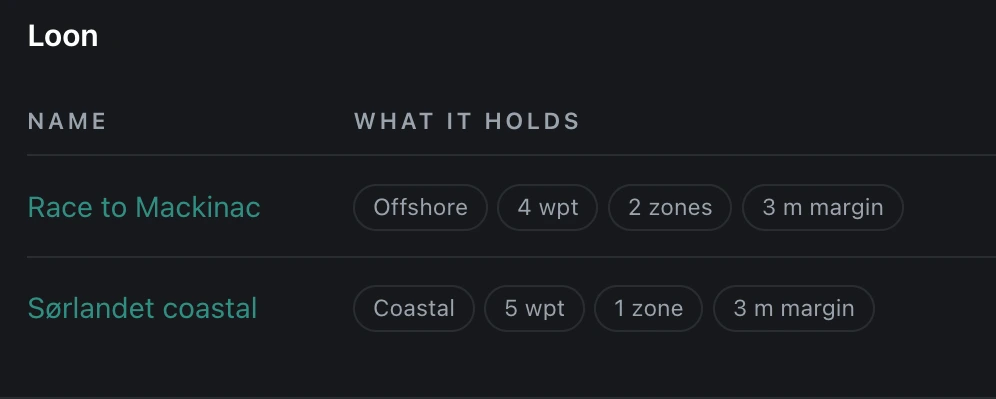
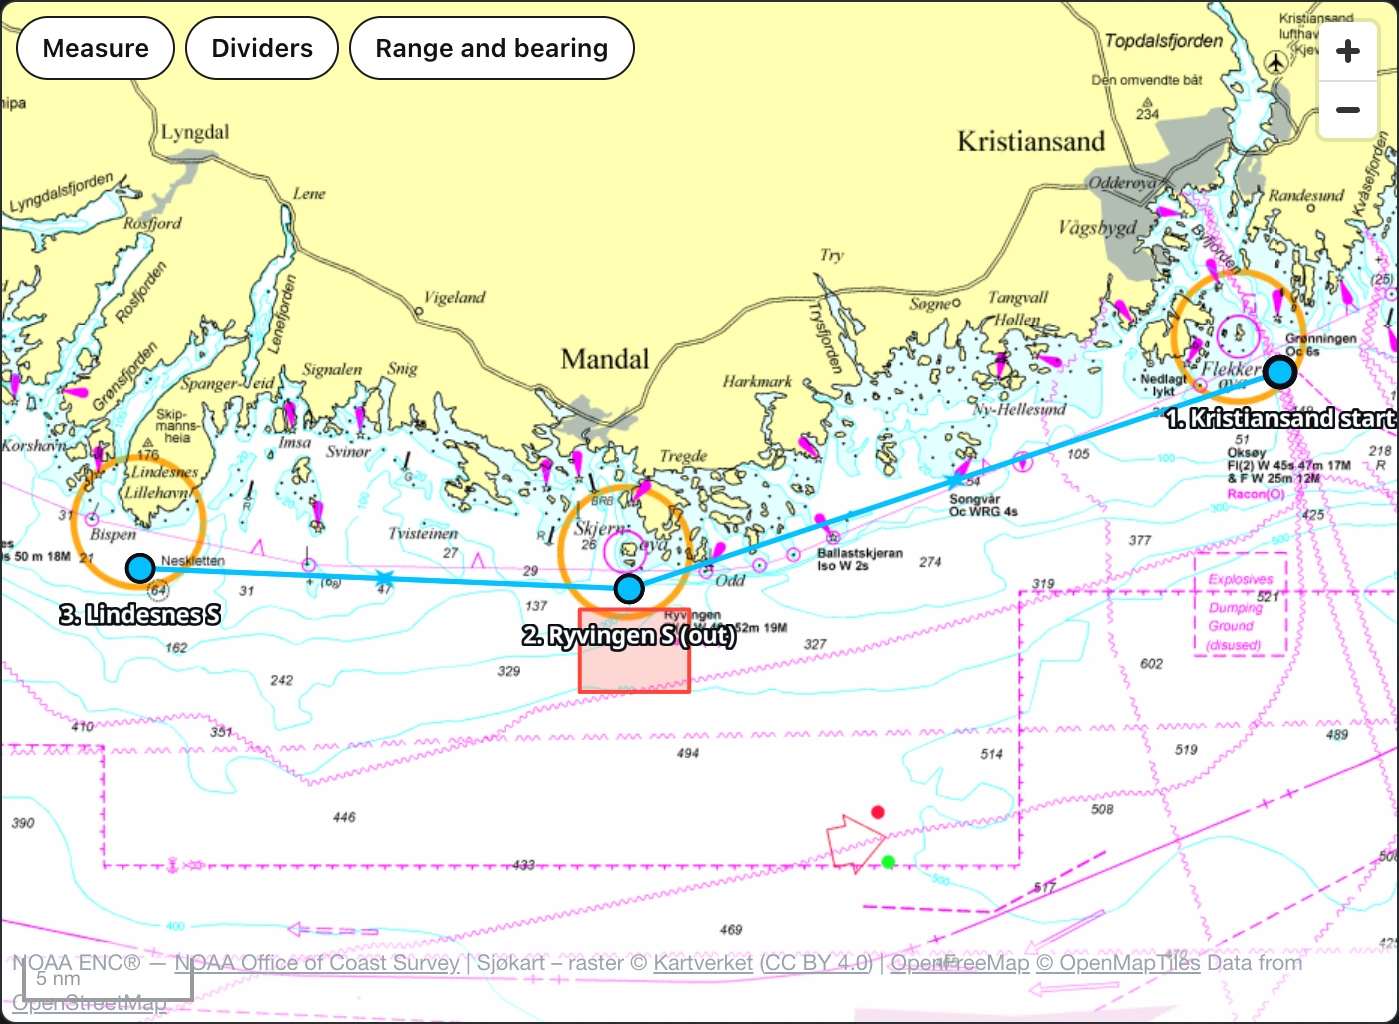
Zones are drawn on the chart, typed as corners, or pasted as a published list of positions — sailing instructions publish an exclusion zone as coordinates, and tracing those off a basemap by eye is a transcription with an error in it. In the browser the course can be drawn over an official raster chart as well as over the platform’s own; that layer is off until you switch it on, and what it covers is set out under Charts below.
The weather fetched for the plan
For every plan with a route, the platform fetches your forecast models on each model’s own run schedule, clipped to a corridor around the route, carrying the tidal stream and the height of tide. The models are ECMWF IFS, ECMWF AIFS, GFS, ICON and AROME, up to four at a time, with each model’s own limits stated beside it on the page that chooses them — AIFS publishes no gusts, AROME’s domain is 37.5–55.4° N, and ICON’s high-resolution European nest stops at 29.5° N with global ICON serving south of it. The boat’s weather page chooses what is fetched; the Weather tab under Navigation lists what has been built.
Two ages are always printed, never one: how old the forecast RUN is, and how old the FILE is. A three-hour-old ECMWF run is the freshest run that exists, so age alone is never called stale — what is flagged is a corridor that no longer covers your route, or a forecast whose horizon has passed.
At sea you can also bring your own file. The tablet imports a GRIB2 forecast you downloaded yourself, names the packings it reads and the ones it declines by name rather than saying “unsupported”, and its refresh is built for a satellite link rather than a pontoon.
The weather viewer
A corridor opens on the plan’s own map: wind speed drawn over the course as a coloured wash with barbs on it for the direction, gust and pressure contours where the file carries them, a scrubber over the file’s own steps, and a meteogram at any point you click. The wash is one block per sample and is not smoothed between them, so it is never drawn finer than the file it came from.
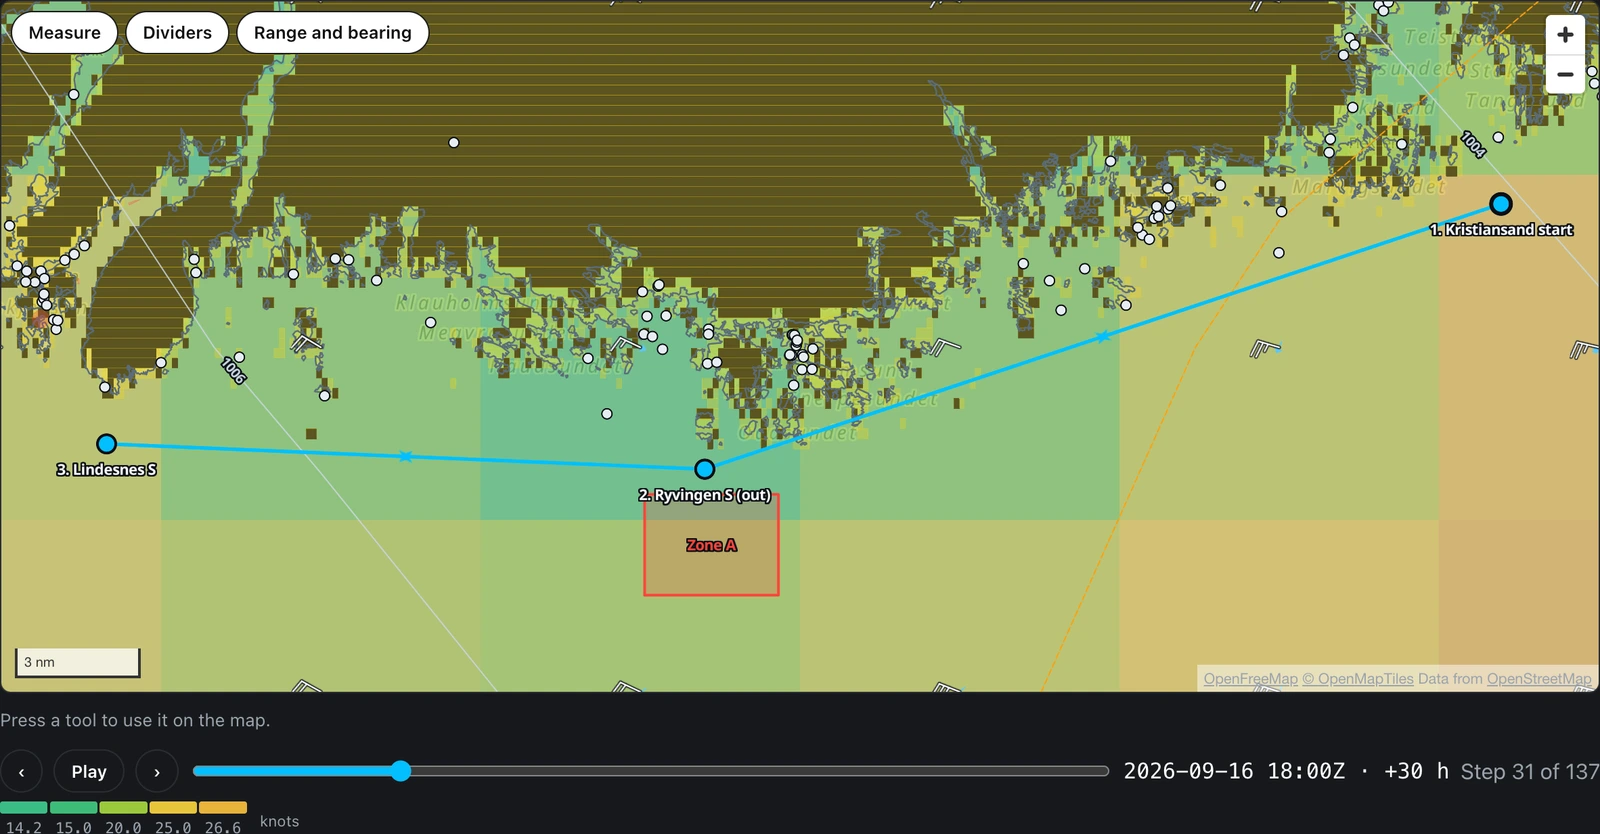
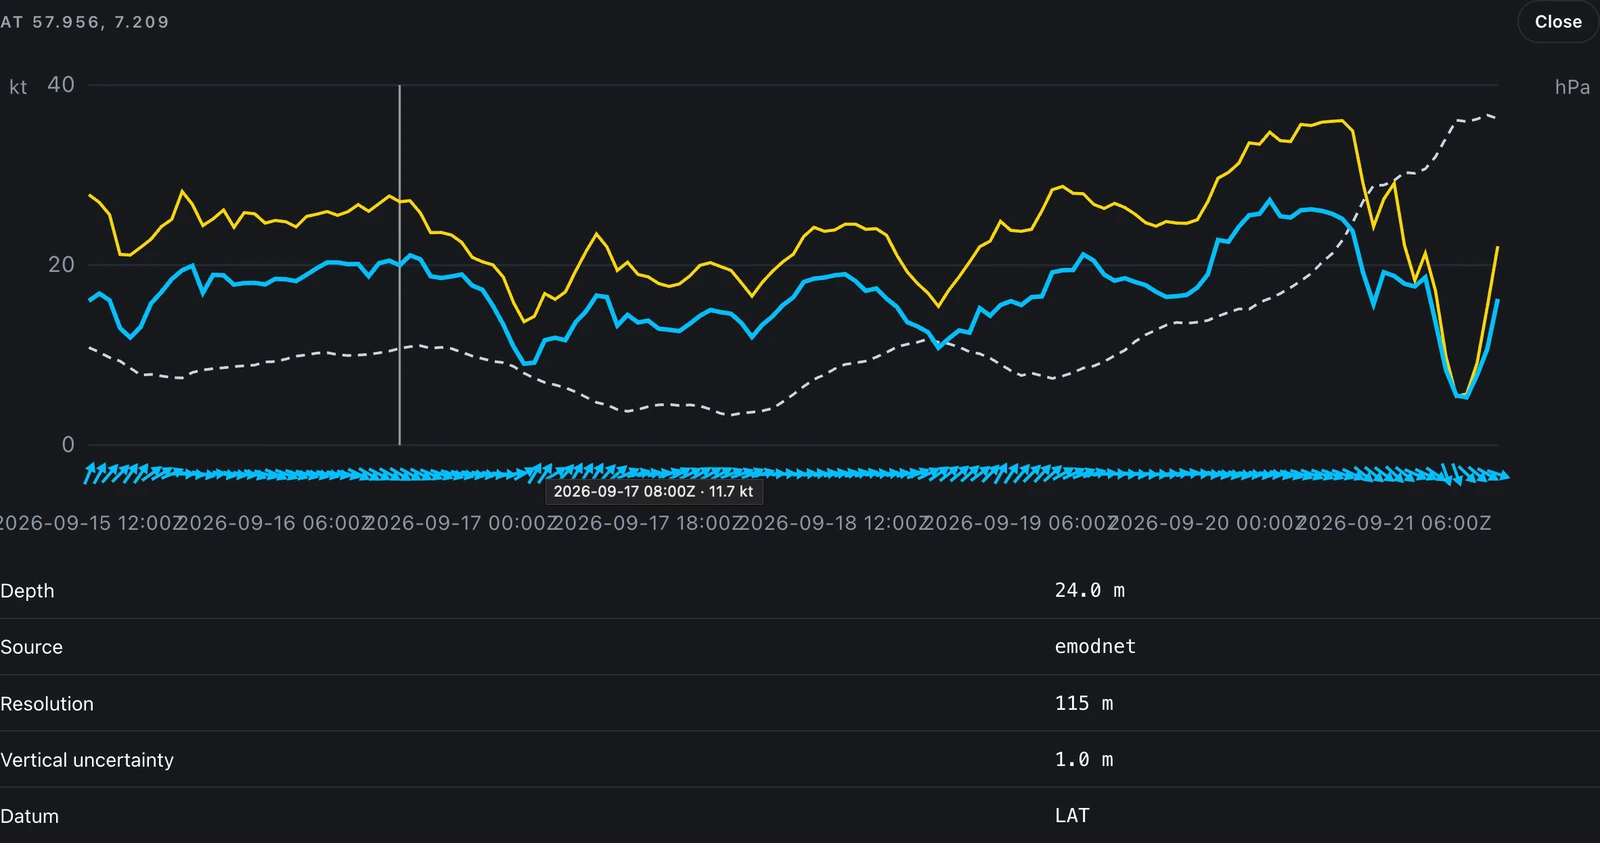
Click any point and the meteogram for that position opens under the map: wind and gusts, sea-level pressure on its own axis, the direction at each step, and the depth at that point with the survey resolution and the vertical uncertainty beside it. A barb that is missing is missing data and never a calm — the viewer draws nothing where the file answered nothing, and a calm draws its own circle. The meteogram breaks its line across a step the file did not answer rather than dropping to zero.
Routing in the browser
The browser and the tablet run the same program, so a route computed here and the same route computed on the boat return the same numbers. That is not a claim about care taken: the routing engine is one Kotlin library, compiled to WebAssembly for the browser and shipped as itself on the tablet, and the same request returns the same double to the last bit.
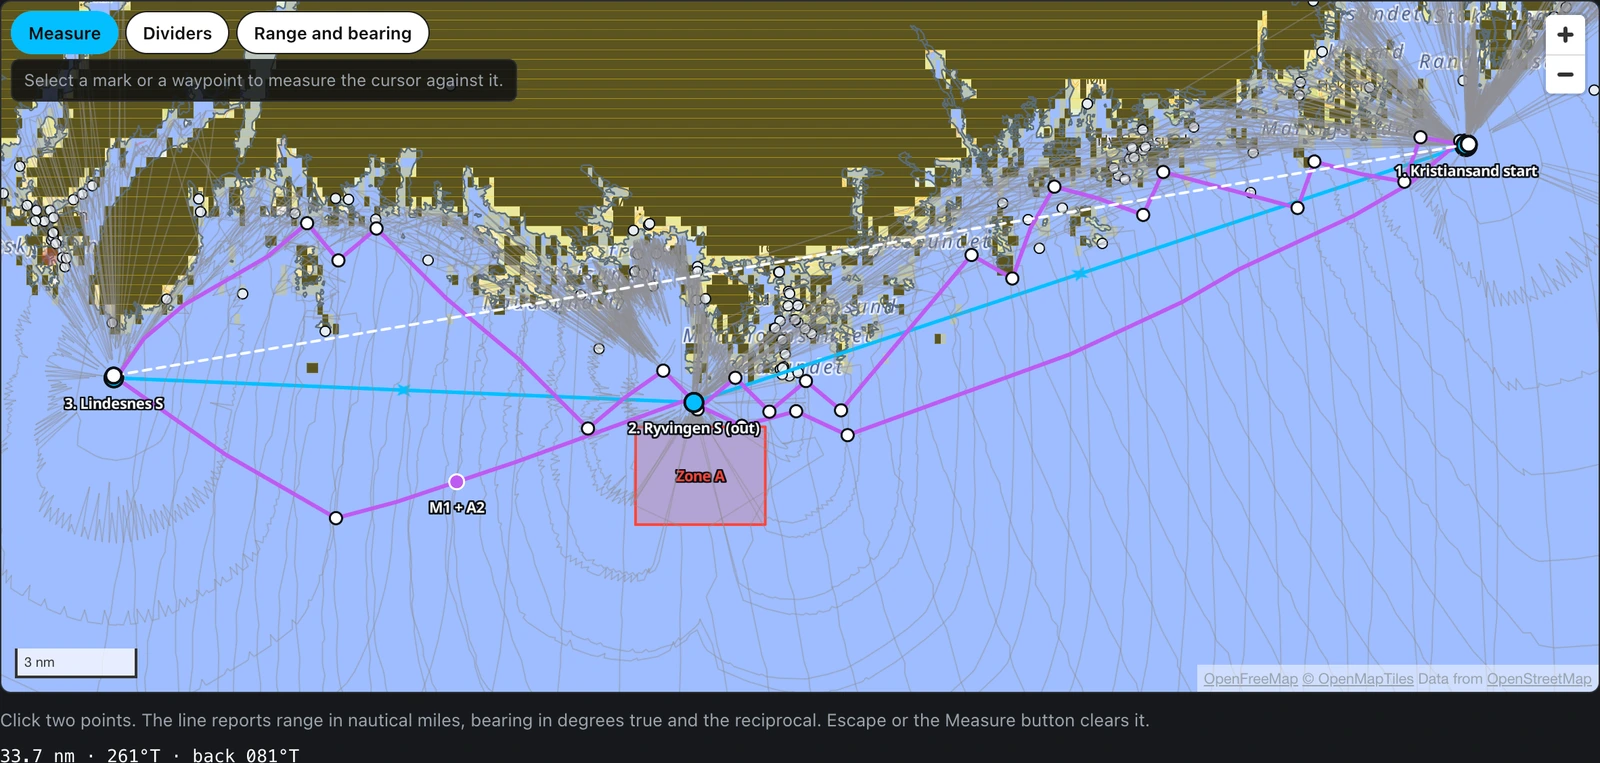
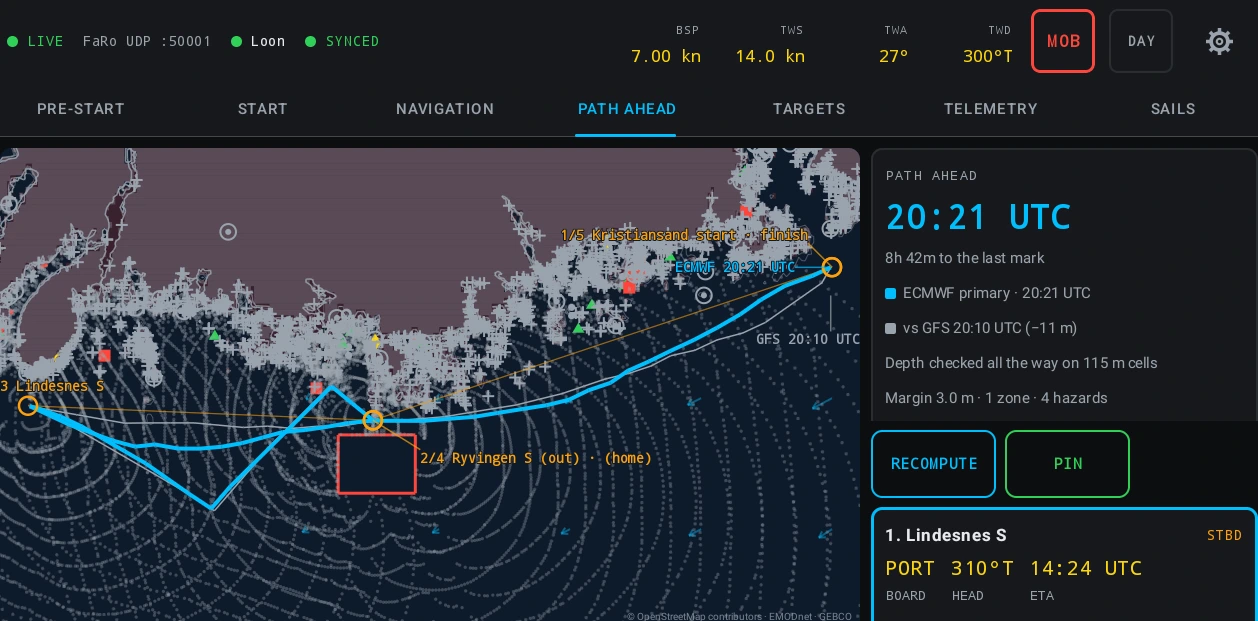
Route the course, and you get the baseline path and the isochrone fans it expanded, drawn on the plan’s own map with a turning point at every tack and a marked point wherever the sail pair changes. The chart tools work on this map like any other, so a range and a bearing off the routed path are two clicks.
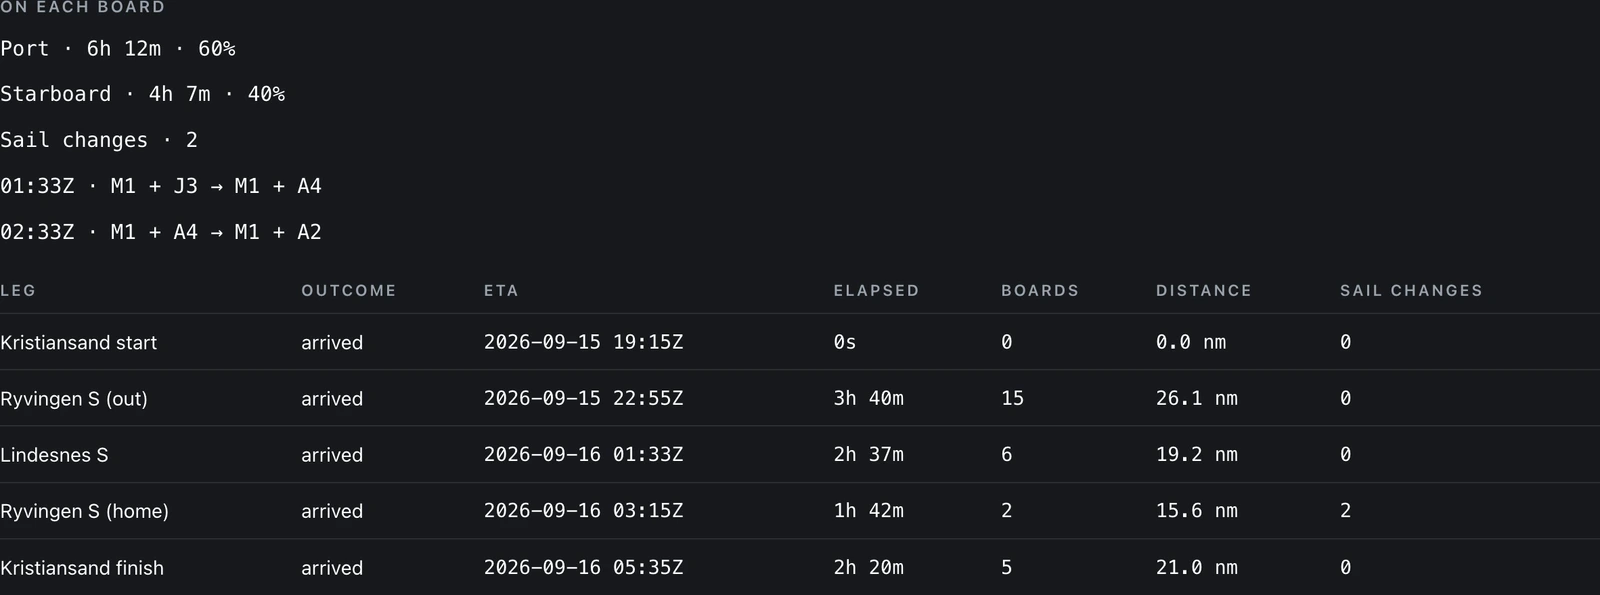
Under the map the run is broken down: how long the boat spends on each board and what share of the passage that is, every sail change with its time and the pair on each side of it, a row per leg with the arrival time, the boards and the distance, and the wind along the route board by board with the sail to fly on each.
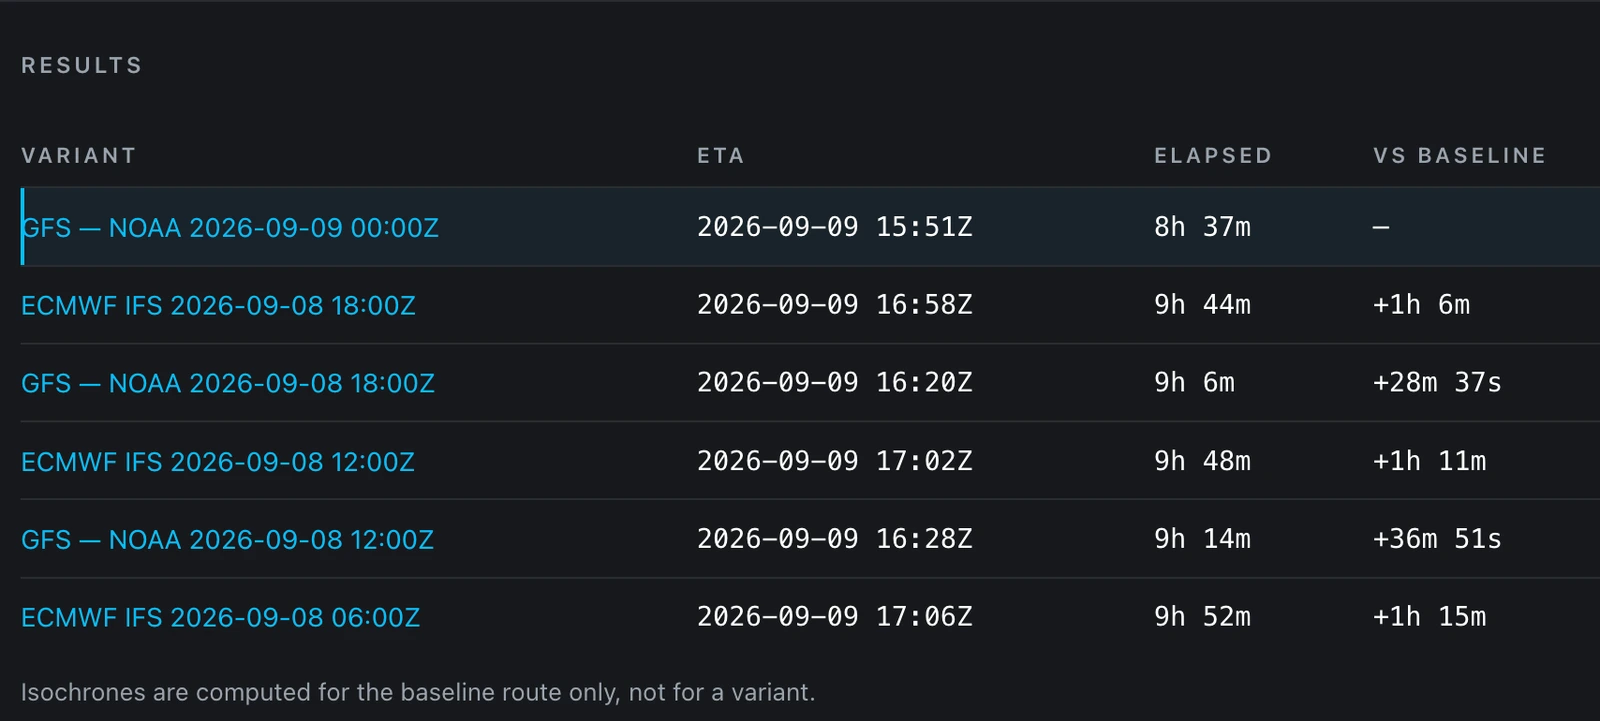
Compare a slower polar, a later start or a second forecast model side by side — those are the three axes the engine takes, and the page names the three it does not: a wind-speed scale, a wind-direction offset and reverse isochrones. Scaling or rotating a forecast would mean writing a new file, and inventing a wind is not something this platform will do behind a slider. Adopt as waypoints writes the computed turning points back into the plan, keeping the plan’s own waypoints, their names and their rounding sides.
Marks, chart tools, the log and the calculator
Marks are organisation-wide: a headland is a fact about a coast, not about a hull, so the whole programme shares one list and a plan that uses a mark copies its position rather than pointing at it. That is deliberate and it is stated on screen — correcting a buoy here does not silently change the shape of twelve plans somebody already saved. Marks import from GPX, and disposal is archiving rather than deletion.
Chart tools — measure, dividers, and a mark placed from a bearing and a range — are on all four navigation maps, and they are inert until you switch one on. A range reads the same number in the same words wherever it is measured, and a position computed from a bearing and a range can be saved as a mark.
The navigator’s log rides the plan, and the Notes tab under Navigation lists the plans that have one, newest writing first across the whole fleet. Beside it, a corrected-time calculator covers IRC, ORC time-on-time and time-on-distance, PHRF both ways and SRS both ways, entirely in the browser with nothing sent to the server. It reads no certificate and applies no sailing instruction, so it is not a scorer, and it says so at the top of its own page.
On the boat
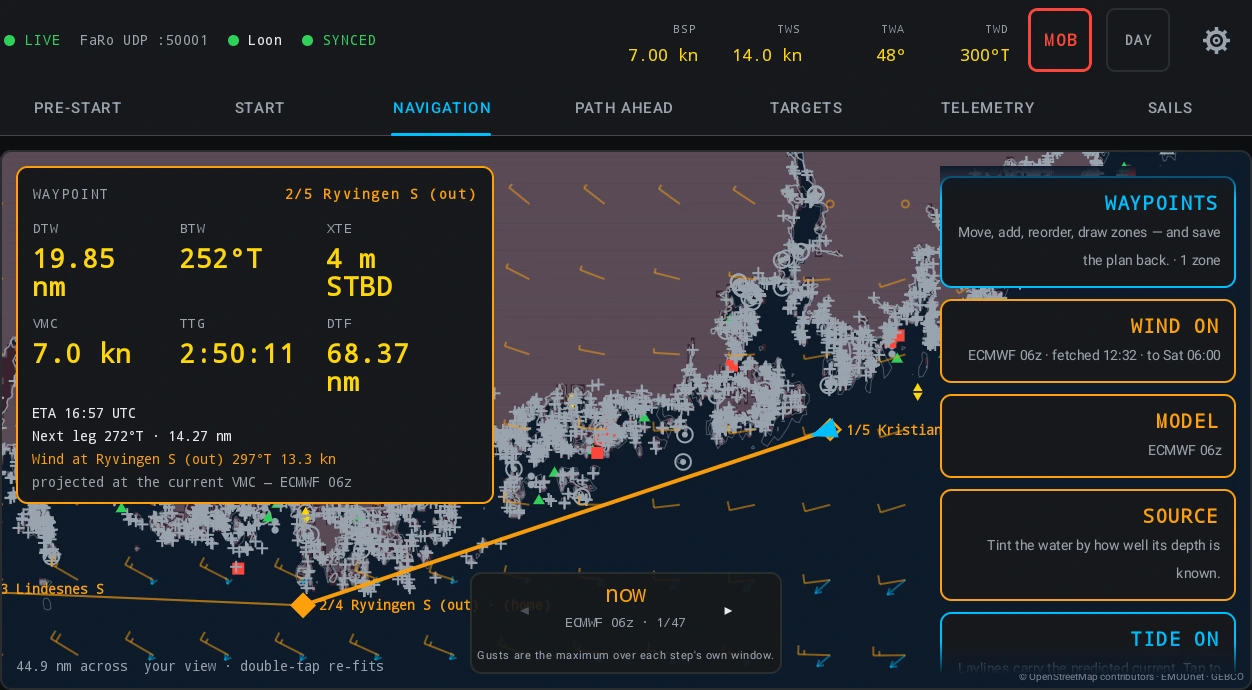
LOAD RACE on the tablet’s NAVIGATION tab takes the plan off the tablet’s own cache, so it loads with no signal at all. With a route loaded, NAVIGATION swaps the mark-laying controls for SKIP, BACK and WAYPOINTS, and the corner of the plot carries six labelled numbers: DTW, BTW, XTE, VMC, TTG, DTF.
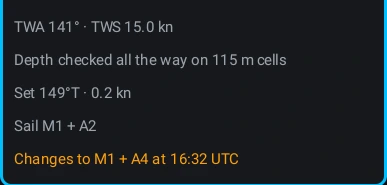
PATH AHEAD then routes the rest of the course from where the boat is, through the forecast the tablet holds, against the depth in the sea model and around the plan’s own exclusion zones. Each leg card gives the board it is entered on, the heading to steer, the arrival time, how long on this board, how many boards, and the sail pair the boat’s crossover chart calls for — with an amber line at each change.
The plan can be changed aboard with no signal. SAVE TO PLAN writes to the tablet and sends when there is a link; if the plan also changed ashore, the tablet offers three answers rather than merging — KEEP MINE, TAKE THEIRS, KEEP BOTH. There is no merge, because nothing on the platform can tell which of two routes is right.
Charts, and the three tiers kept apart
The platform’s own chart is global and is what both surfaces draw by default: depth shading against your own draft, contours, soundings, seamarks, lights and hazards, built from OpenStreetMap seamarks and public bathymetry, with the survey quality it can offer declared per cell rather than borrowed from an office’s own zone of confidence.
Official charts are two different things on two surfaces. In the browser, the plan editor can lay an official raster chart under the course — Kartverket’s Sjøkart for Norway and NOAA’s for the United States, off by default and never at the same time as each other’s water. On the tablet, the official tier is vector ENC cells, and its coverage is the United States today, because NOAA publishes its ENCs for redistribution and European hydrographic offices license theirs. Swedish, Finnish and Danish official charts are not available.
Kartverket’s raster is a browser layer and does not reach the tablet. And what the tablet carries is a repacked corridor extract: it is not an official ENC, it does not meet chart carriage regulations, and its symbols are a racing subset rather than a conformant S-52 presentation. The tablet says which of the two charts you are looking at, in the SOURCE legend and on the probe card, and it says no official chart for this area when it has looked and there is none — which is a different sentence from silence.
What the platform’s own chart resolves
Depth is fused from public bathymetry, finest covering source first, first source with a value winning the cell and nothing averaged: NOAA BlueTopo at 2 to 16 m over US waters, NOAA’s coastal relief model at about 92 m over US coasts, LINZ charted soundings over New Zealand, GMRT at about 100 m where the sea floor has been surveyed, EMODnet at about 115 m over Europe, AusSeabed at about 250 m over Australia, and GEBCO at about 463 m as the global fallback. Lakes above sea level are corrected to their own surface level from HydroLAKES, with chart datums for the Great Lakes and the large Nordic lakes. The resolution that answered is declared per cell, which matters: a corridor served only by the global fallback is coarse, and the probe says so rather than drawing a confident contour over it.
Current comes from seventeen ranked ocean models — thirteen NOAA coastal forecast systems over US waters and the Great Lakes, four Copernicus Marine regional products, and the Copernicus global product behind them. The finest model whose own published area contains the whole corridor, and which answers, wins the whole of it. One source per corridor, never spliced, and its name, its resolution and whether it already includes the tide travel in the file’s own header. Tide height is fused separately, per corridor.
Two bathymetry sources do not share a zero — EMODnet is referenced to the lowest astronomical tide and GEBCO to mean sea level — and that is stated rather than smoothed over, because a depth is only as good as the datum under it.
Deck channels and instrument output
The boat keeps a document saying what Race Control transmits back onto its own bus: the gateway kind and address, the slots, the transport, the key, the value each slot carries, its label, decimals, damping and rate. It transmits the app’s own computed values — time to gun, time to burn, distance to the line, line bias, laylines, targets — and never wind or boat speed, which are the instruments’ own.
None of this has been checked against a physical display, and Garmin slots transmit nothing at all — the NMEA 2000 message that carries Garmin custom data has not been identified, and the transport is in the list so the document can describe a Garmin boat. Both limits are printed where the document is edited, and neither is softened here.
If you already navigate with Expedition
This table says two things and no others: what Nordic Stars does, and which Expedition file formats and tables Nordic Stars reads. It makes no claim about Expedition. The mapping is interoperation, not a comparison.
| What you already have | What Nordic Stars does with it |
|---|---|
Race logs (.csv) and the matching event files | Imported as a day. Guns and line pings arrive as race events; the event times are venue-local with no zone marker, so the import asks which venue you sailed and anchors them to UTC. |
| Polar tables and VPP output | Uploaded as the boat’s polar, in one of three roles — start, nav and perf. The tablet routes on nav; perf is the yardstick a percentage is measured against. |
| CAL tables — acceleration, rate of turn, braking | Read off the boat by the tablet and charged to every routed path: the turn time plus the speed it costs to get back up. The units are Expedition’s, verbatim, because converting them would make every future disagreement two-sided. |
| The column names your files are written with | Mapped onto the platform’s channel registry at import, with the mapping remembered per format and shared across your organisation; anything the registry has no name for becomes one of your own custom: channels. |
| The GRIB you download yourself | Imported on the tablet. The packings it reads and the ones it declines are named by name in the guide. |
| The committee’s GPX | Imported into a race plan: a route first, loose marks second. A recorded track is counted and not read — a track is where a boat went, not a course to sail. |
| The numbers you want on a mast display | Instrument output over a gateway, carrying the app’s own computed values only. One of the three gateway transports speaks Expedition’s simple protocol. See the limits below before relying on any of it. |
How it works
- Draw the plan: waypoints, rounding sides, zones, depth margin.
- The corridor forecast arrives on each model’s own schedule.
- Open it in the viewer and read the wind along the course.
- Route it, compare the variants, and adopt the path you want.
- LOAD RACE on the tablet at the dock, while there is still wifi.
- Sail it with NAVIGATION and PATH AHEAD, with no signal.
- The day is in the debrief player when you tie up.
What it does not do
A computed route is a planning result, not a passage plan. It follows the forecast in one file and the depth in one sea model, both of which can be wrong or incomplete, and the ship’s plotter stays the navigator’s authority. This is race navigation support.
- No autopilot and no steering output. Instrument output puts numbers on a display; nothing on this platform steers a boat.
- No write-back of calibration to the boat’s processor. A correction is a read-time lens on the platform’s own copy of the data — see Data Analytics — and the instruments go on reading what they read.
- No encrypted S-63 vector charts on any tablet. The licensed tier exists in the platform and is off; every boat on the platform today falls through to the open NOAA cells. No official charts outside the coverage named above.
- No native NMEA 2000 live ingest — the tablet reads a gateway that puts the bus out as NMEA 0183 — and no B&G H5000 websocket source.
- Instrument output has never run against a physical display, and Garmin slots transmit nothing.
- The sail crossover chart and the routing limits are per tablet and do not sync; a second tablet aboard keeps its own copy, and the browser reads neither. The browser’s own sail column is read from a chart built from the boat’s registered wardrobe, one wind range per sail from its category — ordinary shapes of use rather than measurements, and not the crew’s own numbers. The routing limits it reads not at all.
- Routing limits are not a weather warning and not a rule check: the tablet does not know which race you are sailing or what its sailing instructions say about propulsion. Motoring is off until somebody turns it on, motoring never opens the no-go zone, and every routed leg that uses it says so.
- An exclusion zone written into an exported GPX rides our own extensions, so no other program reads it, and GPX import brings in routes and marks rather than zones.
- The routing comparison offers a polar scale, a start offset and a second forecast model. It names on screen the three axes it does not offer — a wind-speed scale, a wind-direction offset and reverse isochrones — rather than leaving a navigator to hunt for them.
- A mark used by a plan is copied into it, so correcting a buoy in the marks list does not change the shape of the plans that already used it. The screen says so.
- The corrected-time calculator is not a scorer.
Two things this section deliberately says nothing about, in either direction: waves and storm surge. The sea model does not carry them, and an absence claim would be as unsourced as a presence claim.
Common questions
Does the route computed in the browser match the one on the boat?
Yes. The browser and the tablet run the same routing program — one Kotlin library, compiled to WebAssembly for the browser and shipped as itself on the tablet — so the same request returns the same numbers.
Which forecast models are fetched for a race plan?
ECMWF IFS, ECMWF AIFS, GFS, ICON and AROME, up to four at a time, on each model’s own run schedule and clipped to a corridor around the route. Each model’s own limits are stated beside it: AIFS publishes no gusts, AROME covers 37.5–55.4° N, and ICON’s high-resolution European nest stops at 29.5° N.
Can I sail the plan with no signal?
Yes. LOAD RACE takes the plan off the tablet’s own cache, and the forecast, the sea model and the chart are fetched at the dock rather than at sea. PATH AHEAD routes the rest of the course from where the boat is, offline.
Are official charts included?
In the browser, official raster charts cover Norway and the United States and are off by default. On the tablet, the official vector tier covers the United States today. Everywhere else both surfaces draw the platform’s own chart, and the tablet says which of the two you are looking at.
Is a computed route a passage plan?
No. A computed route is a planning result. It follows the forecast in one file and the depth in one sea model, both of which can be wrong or incomplete, and the ship’s plotter stays the navigator’s authority.
Where to read more
- Navigation — The navigator’s own section: every race plan the fleet holds in one list, the weather already fetched for each routed plan and what makes a corridor stale, the viewer that draws a forecast on the chart and how to read a wind barb, routing a course in the browser with the tablet’s own engine and comparing the variants that change the answer, the marks the whole organisation reuses and why a plan copies one rather than pointing at it, the chart tools that measure a range and bearing and place a mark from one, the navigator’s log and routes pinned from the boat, the deck channels a boat transmits to its own instruments, and taking a plan away as GPX.
- Race plans — Planning a coastal or offshore race ashore: the map, waypoints and rounding sides, exact positions in degrees and decimal minutes, the water to avoid and the depth to keep under the keel, importing the committee’s GPX — and what happens when two people edit one plan.
- Weather — What the platform fetches for a boat’s routed plans and what it cannot tell you: the models and the limit each one carries, the corridor margin, taking the bundles at the dock, and reading the staleness line and the barbs at sea.
- Your own GRIB, and weather at sea — Importing a forecast file you already have and refreshing the weather once you have left: which GRIB formats the tablet reads and which it declines by name, getting a file across from mail, what the import summary says it left out, and a download built for a satellite link.
- Currents and tides — The tidal stream and the height of tide: where each comes from, what the current changes in the routing, in the laylines and on the chart, the units and datums they are stated in — and the limits, including no surge and a grid that does not resolve a harbour.
- Planning a coastal or offshore race — A race whose course is known days ahead: drawing the plan ashore with marks, rounding sides, exclusion zones and a safety margin, the corridor forecast built for it, routing the course in the browser and adopting the result — then LOAD RACE, NAVIGATION and PATH AHEAD on the tablet, the alarms, sailing through midnight, and the debrief.
- Laylines and board times — Where the tacking angle comes from and how long to hold this board: the source chain behind a layline, the two-board solve, and which mark the plan is aimed at.
- The boat’s clock — Why the tablet stamps nothing: the instruments’ clock carried forward as an offset, freshness judged source against source, and the one question the tablet does answer.
The rest of the platform
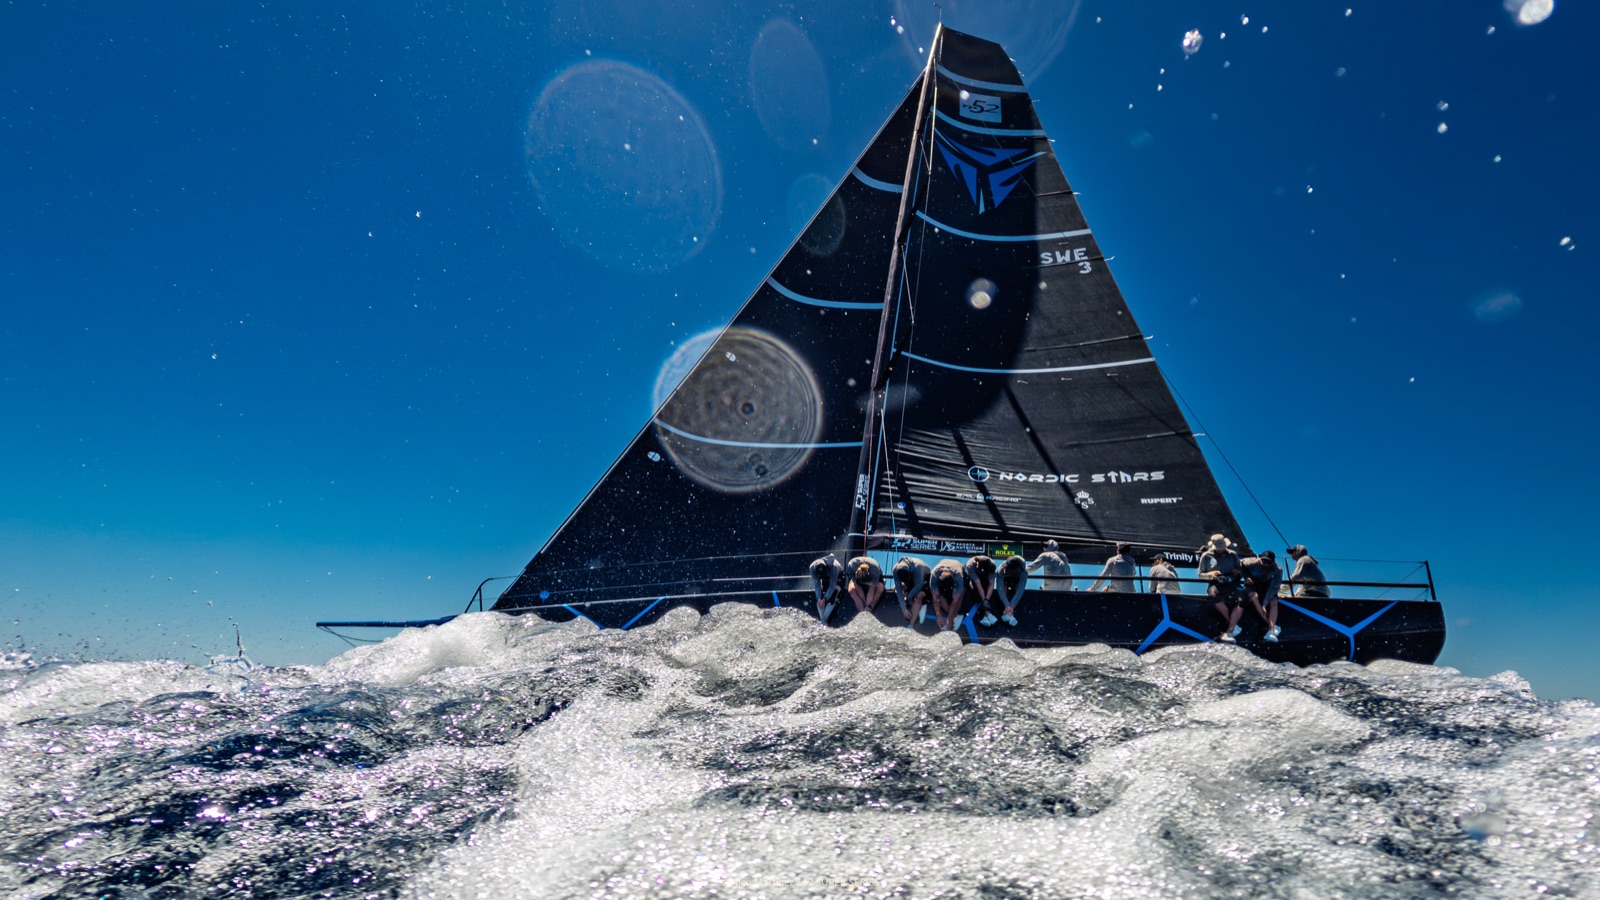
Plan the race ashore, sail it on the boat.
Draw the course, take the forecast at the dock, and route it with the engine the tablet runs at sea. Every account starts with a 30-day free trial for one boat, no card required.