
The numbers
Data Analytics
Open any channel the boat logged, compare several on one chart, and read every moment against the boat’s own targets.
Who it is for
The performance lead, the coach and the analyst. The job is to compare values and to measure the boat against a reference that can be defended — which is why every number on this page has a source you can open.
The two windows this section is about open inside the debrief player. The Explorer and the tuning guide are floating windows, opened from pills in the player’s topbar — the Debrief Player is the instrument, and this section is what it measures against. Everything else here is its own screen in the app.
The Explorer
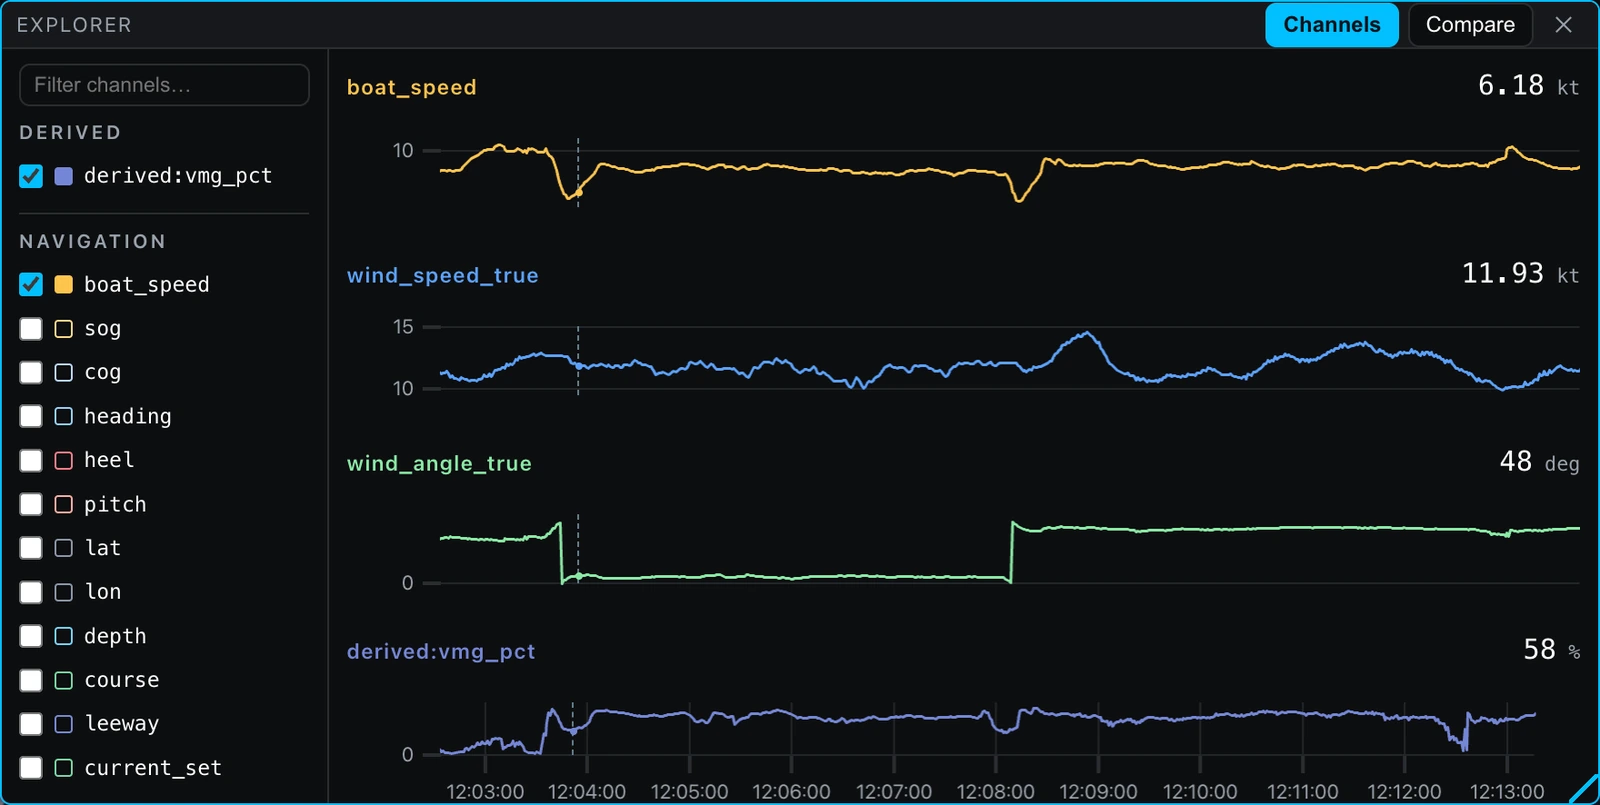
One channel list, filtered and ticked, with three channels on by default — boat speed, true wind speed and true wind angle — and two tabs over it.
Channels draws one strip per channel: the name in its series colour, the value at the cursor, and the trend under it. Click a strip to send the whole player to that instant, drag sideways to set the timeline’s view, double-click to fit the race, and hover to read the same instant across every strip at once.
Compare puts the selected channels on one chart, grouped by unit, so knots are never plotted against degrees. The first two unit groups get labelled axes — knots on the left and degrees on the right, typically — and further groups still draw, which is why the sidebar carries a live value beside every channel. A channel a correction is being applied to carries a small cal badge.
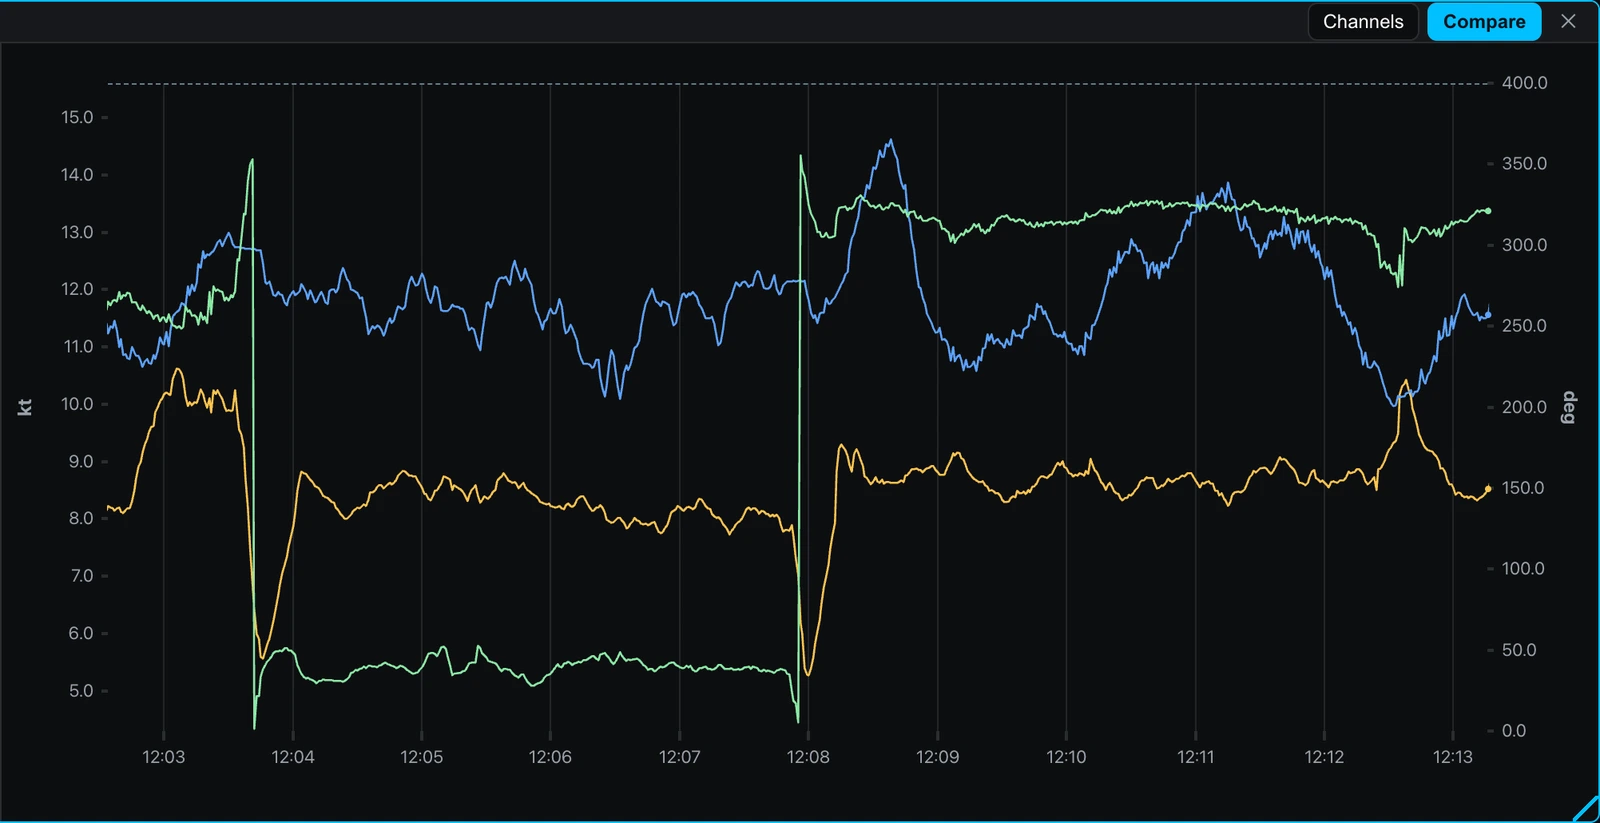
The window’s size, position, tab and selection are remembered. Data is seeded from the page’s own batch and topped up lazily in 16-channel chunks, so zooming into a stretch of race refetches nothing. It opens from the Explorer pill in the player’s topbar.
The tuning guide
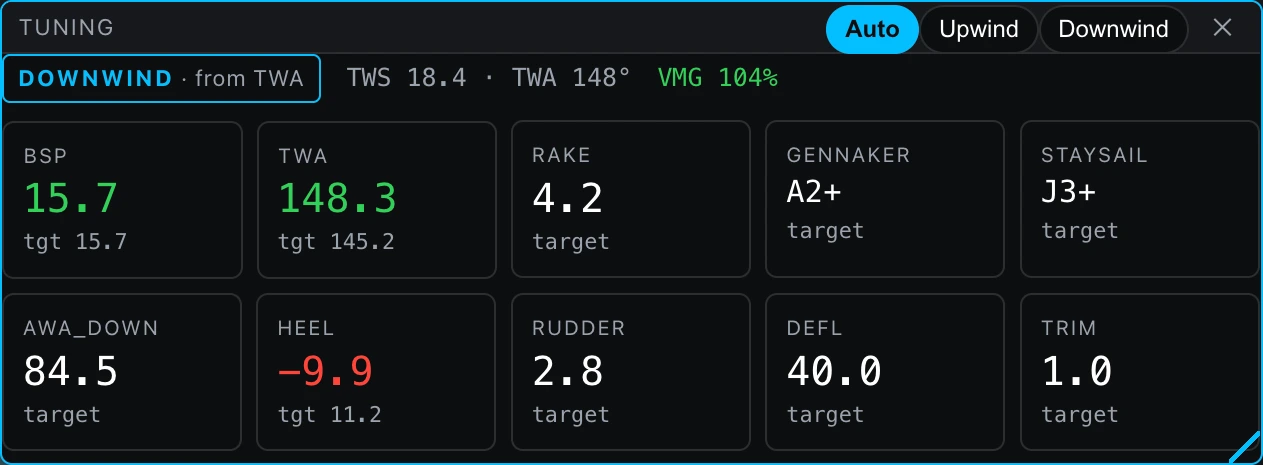
The boat’s own tuning sheet, read at the wind you actually had: one tile per column, in the team’s own column names, with the upwind or downwind table picked automatically or forced. It opens from the Tuning pill in the same topbar.
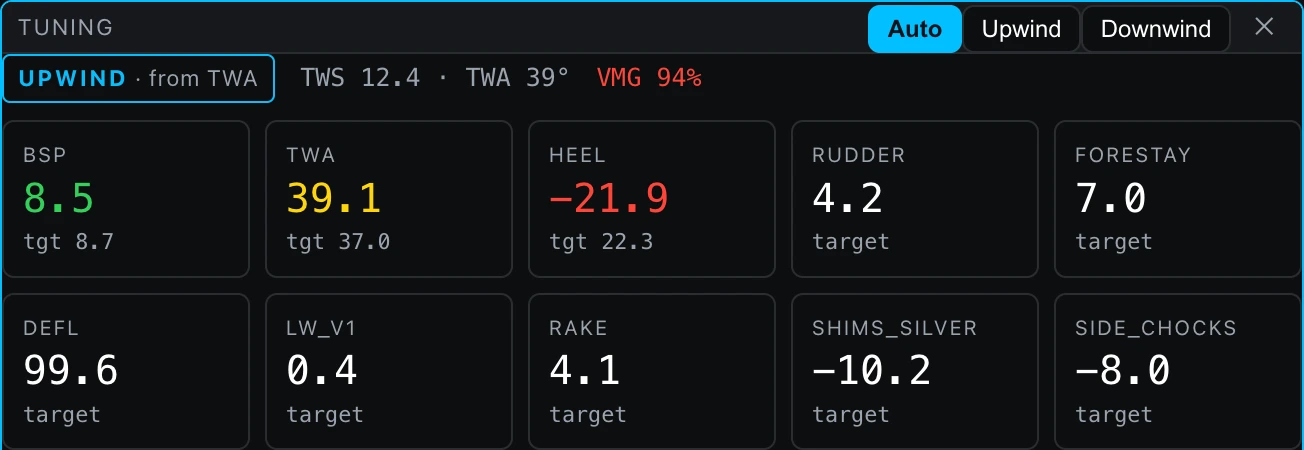
A word cell — A2, Max — is shown as written and never graded, because a named sail has no deviation to measure. It stands in the same row of tiles as the graded numbers and carries the word target under it, as every target-only column does.
Polars and target sheets
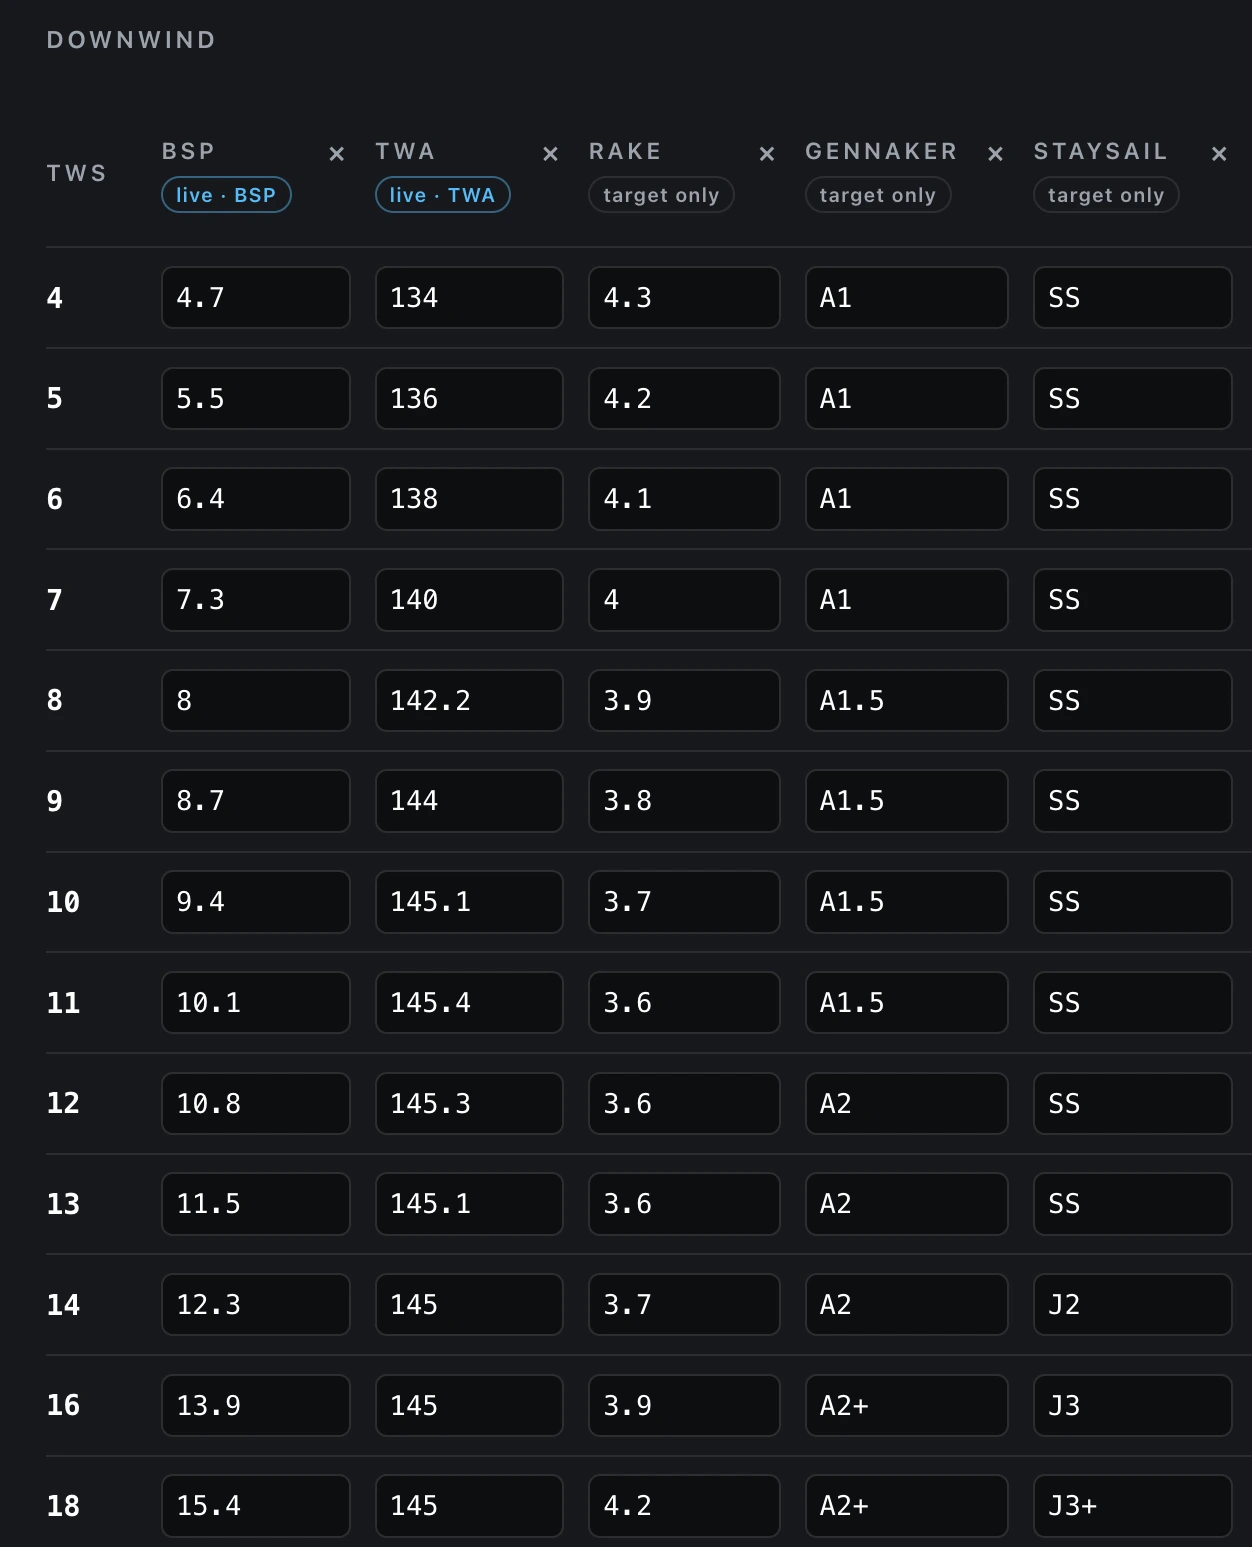
Upload the boat’s polar — .pol, an Expedition table, or VPP output — and keep tuning targets per mode in editable tables, and every moment of the race gets a percent-of-target, upwind and down, interpolated at the wind you actually had rather than read off the nearest row.
Target sheets are free-form on purpose. The columns are whatever your team calls them, and a cell may be a word as easily as a number. Words hold from their row until the next row that has one, and they are never graded.
The sheet you already keep comes across as it is. Import the team’s CSV — first column TWS, the delimiter detected because Excel writes semicolons in comma-decimal locales — and the preview suggests a name for each column head without renaming anything for you. Every column then carries a permanent chip saying whether it is compared against a live channel or is target-only, so a column called bs cannot lose its comparison with nothing on screen saying so.
Calibration as a read-time lens
A masthead vane mounted three degrees out puts a three-degree error in every wind angle the boat recorded. The usual fix is to rewrite the log, which makes the error permanent and unrecoverable. Calibration never changes stored data: your instruments’ readings are kept exactly as they were recorded, and a correction is applied when the data is read. Delete an entry and everything reads as it did before. It is a lens, not an edit, which is what makes it safe to try one.
An entry is linear — an offset, a scale, and the instant it takes effect from — and it applies at every zoom level, precomputed summaries included. Pick an angular channel and the scale field disappears rather than greying out, because angles rotate and do not scale. Wherever the debrief prints a number a correction was applied to, that number carries the cal badge.
Guided calibration
You do not have to guess the offset either. The platform measures it and suggests it; a person applies it. Pick a window of the boat’s own sailing — Today, Yesterday, the last 24 or the last 48 hours, 48 hours being the maximum — and the analysis reads the tacks in it. Three methods are named on screen: tack symmetry, a wind-axis cross-check, and boat speed against SOG. Findings sort into the ones worth applying, the ones marked measured, but not recommended, and the ones marked also measured.
The analysis stores nothing, and applying a finding writes the same ordinary entry you would have typed by hand, so it deletes like any other. It also runs two checks against itself. When the error is not a constant at all, no single linear entry can correct it, and the panel says so instead of giving you a number. And when one board was sailed faster than the other — a crew can produce the same signature by sailing one side lower and faster — it prints both boards’ times, median wind angle and median boat speed, and states that the asymmetry may be the sailing rather than the vane.
Beside it, the upwash profile resolves the same cross-check per two-knot wind band. It is chipped Measurement, not a suggestion and carries no button at all: a per-band error is not linear in the stored value, so it cannot ride the lens. It can prefill a wind-angle correction table, which is chipped Draft — nothing is saved until you save it.
Screen capture to come
The calibration timeline with an entry in force and a number carrying the cal badge, and an Analyze result including either a refusal or a both-boards warning.
Channels and mapping
Three kinds of channel name, and the screens keep them apart: the standard registry, which is platform vocabulary and read-only for every role; your organisation’s own custom: channels; and whatever your files happen to call things. The mapping you make once is remembered per format and shared across the organisation, the columns nobody has claimed are listed rather than dropped, and derived channels are computed at read time from what was stored.
Five ways in, one debrief
Four file formats and one live feed. What they produce is the same day in the same player.
- Expedition — race logs as
.csvwith the full channel set, plus the matching events file for start guns and line pings. - Vakaros — Atlas recordings, as native
.vkxor the Vakaros Connect CSV export. Prefer the.vkx: it also carries the race timer and the line pings the device recorded. Heading, heel and trim are derived from the recorded orientation in a.vkx; the Connect CSV carries all three as columns of its own. - B&G / NMEA 2000 — a
.zipof your Yacht Devices YDVR recorder’s data folder, or a bare.DAT. The recorder captures the whole bus; the platform decodes the sailing messages in it server-side, B&G performance values included: target boat speed, target wind angle, VMG and distance to the start line. Messages outside that set are counted in the preview and skipped. - NMEA 0183 — a raw sentence log as text (
.log,.txt,.nmea), one sentence per line, from any talker: position, speed, heading, wind and depth. The file’s ownRMCorZDAsets its clock and every later line inherits it, so lines logged before that first fix are dropped — and counted, with the rest of the census, in the preview. Performance values are not in this format; those come from the NMEA 2000 recording above. - Race Control, live — no file, nothing to upload. A boat running the tablet app streams as it sails, and the platform builds the day from that stream: one import row per boat per UTC day. The tablet reads the boat over FaRo (UDP) or NMEA 0183 (TCP or UDP), so anything that puts 0183 on the boat’s network feeds it — a B&G H5000 or Hercules through a multiplexer, or an NMEA 2000 bus through a gateway that converts it.
Nothing is committed unseen. An upload is previewed first — the channels found, the time range, the events, and which of the log’s own column names map onto which platform channel — and you commit that. Imports are idempotent by content, so the same file uploaded twice never duplicates a race: the second attempt finds the import that already exists and links you to it.
Expedition writes its event times venue-local with no zone marker, so the import asks which venue you sailed and anchors the guns to UTC from there. One dropdown, and it is the difference between a start gun on the timeline and a start gun two hours off it.
Every hour every sail has flown
A sail wears out by the hour, and hours are what the platform counts. Each boat keeps a wardrobe — every sail it owns, retired ones included — and a log of the minutes each one has flown. The crew’s taps in Race Control fill that log — up, down, swap, docked — and you type in what the app was not there for: the delivery, the practice day, the seasons before the tablet.
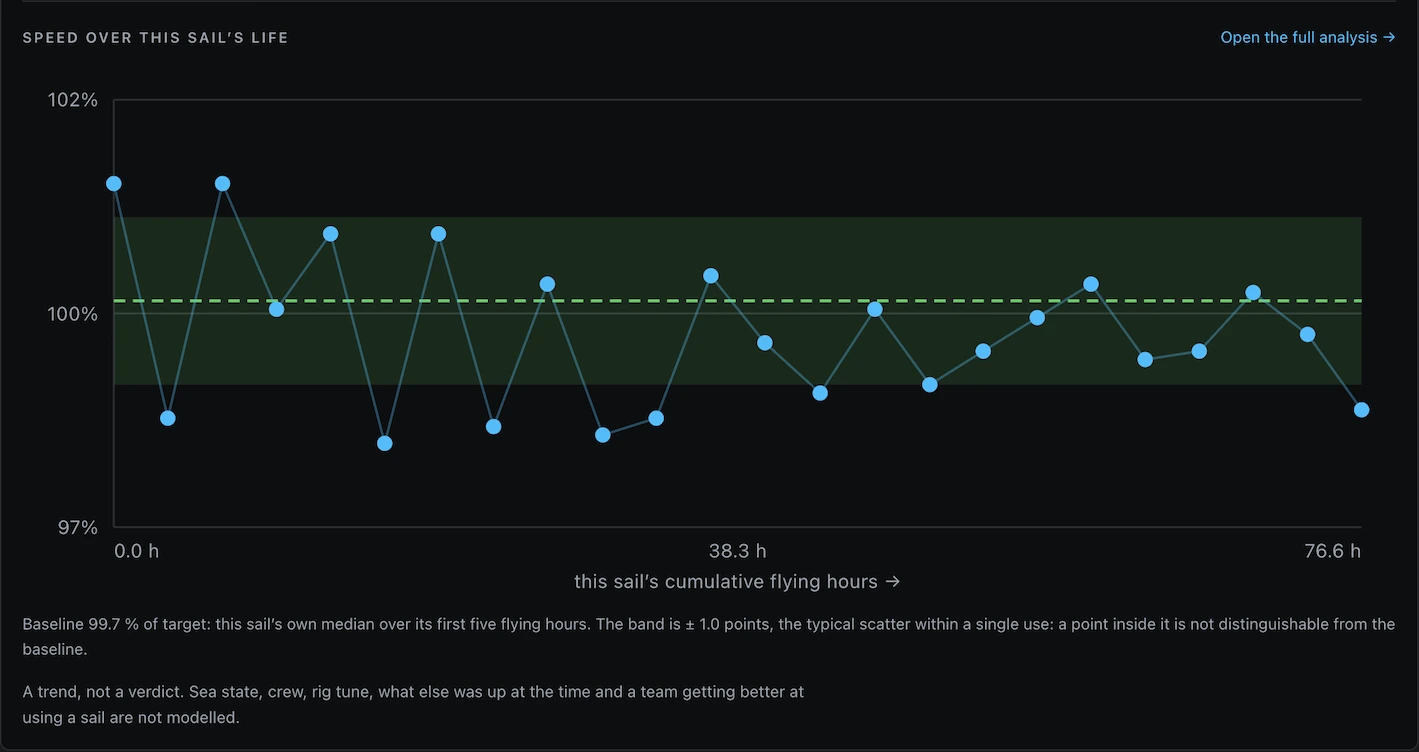
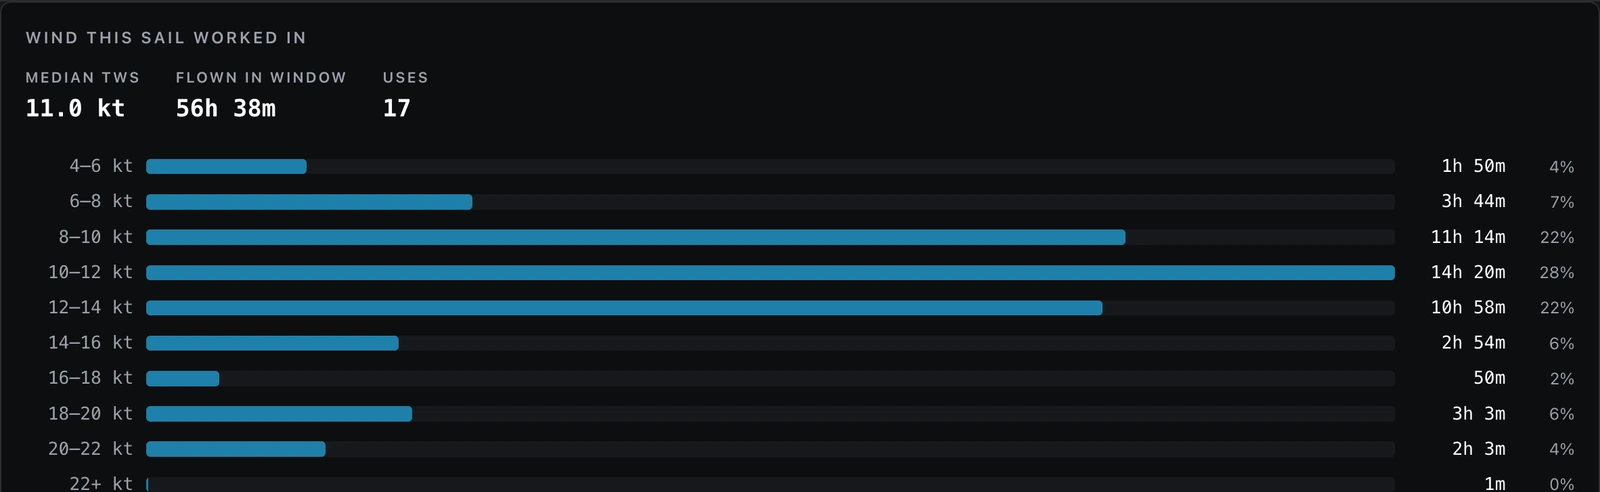
The platform joins those minutes to the boat’s telemetry, so each sail reports the wind it flew in: total time, median TWS, and the two-knot bands the hours fell into. Speed against the boat’s own targets is plotted across each sail’s life — and it is a trend, not a verdict. Sea state, crew, rig tune and what else was up at the time are unmodelled and all real, so the chart draws the scatter each point already carries rather than an invented tolerance.
Sail performance
Every sail also has a page of its own. The hours and the wind bands say what a sail has done; that page answers the harder question — not whether anything is happening, but how much, in which wind, and how sure. The sail is compared with itself. Prime is its earliest sailing and current is its latest — each window at least ten flying hours, and the two never overlap. What is compared is the speed the boat made good toward or away from the wind against the best the boat’s own polar says it could have made good at that wind speed, so the number falls whether the sail is slower or the boat is sailing lower.
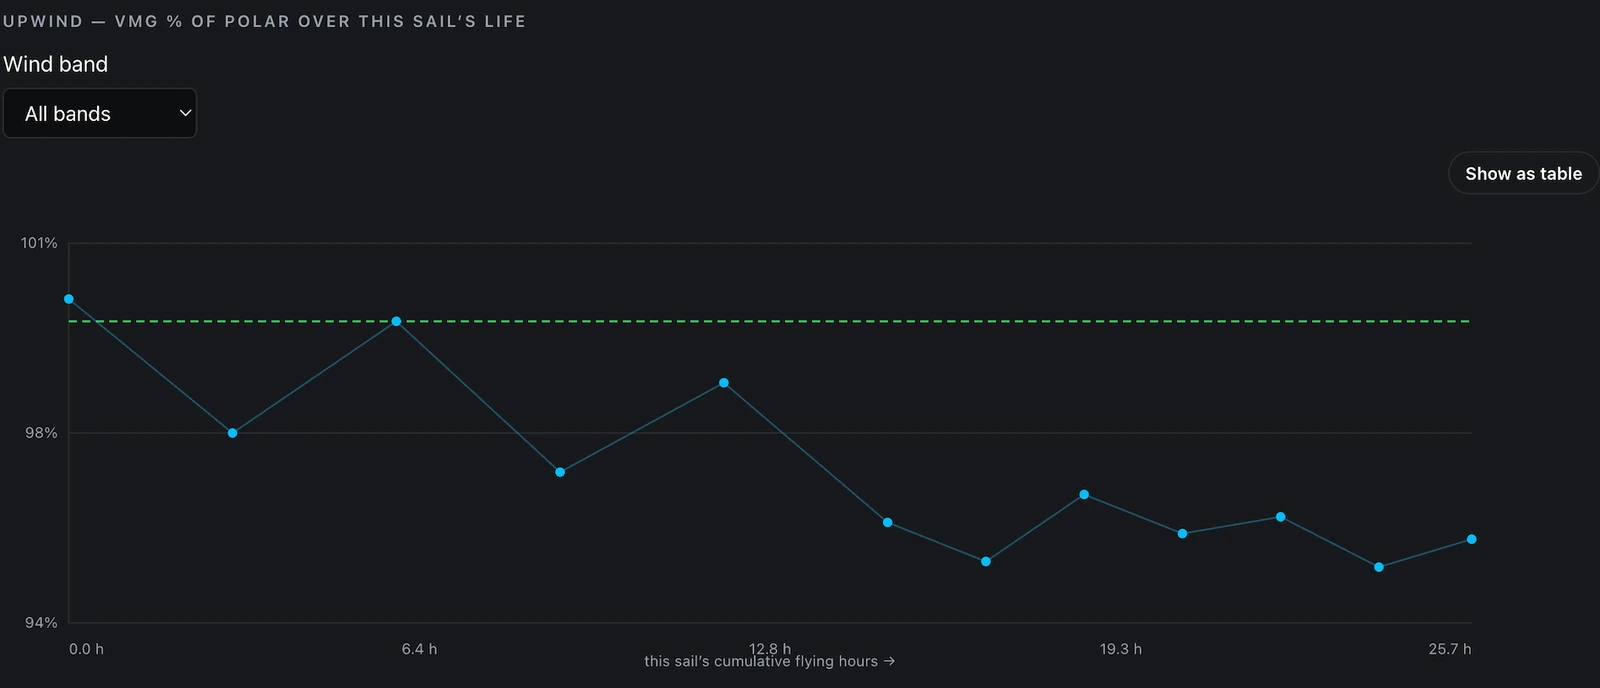
Only steady sailing is scored — a tack is not evidence about a sail — and what survives is filed by point of sail and by 2-knot wind band, because a light-air stretch says nothing about a sail in a breeze. Which bands can answer at all is therefore a fact about the sail’s own hours, and the wardrobe panel is where you read them.
Each band is then reported as three things: a difference in points, an approximate 95 % interval around it, and one of four words — down, up, no detectable change, or not enough evidence. The word is read from the interval and from nothing else. A large difference with a wide interval reads no detectable change; a small difference with a narrow interval reads down. There is no threshold behind those words and no fifth word. A band with too little sailing behind it keeps its counts and says which gate it failed, rather than dropping out of the table and leaving a gap that reads as an absence of wear.
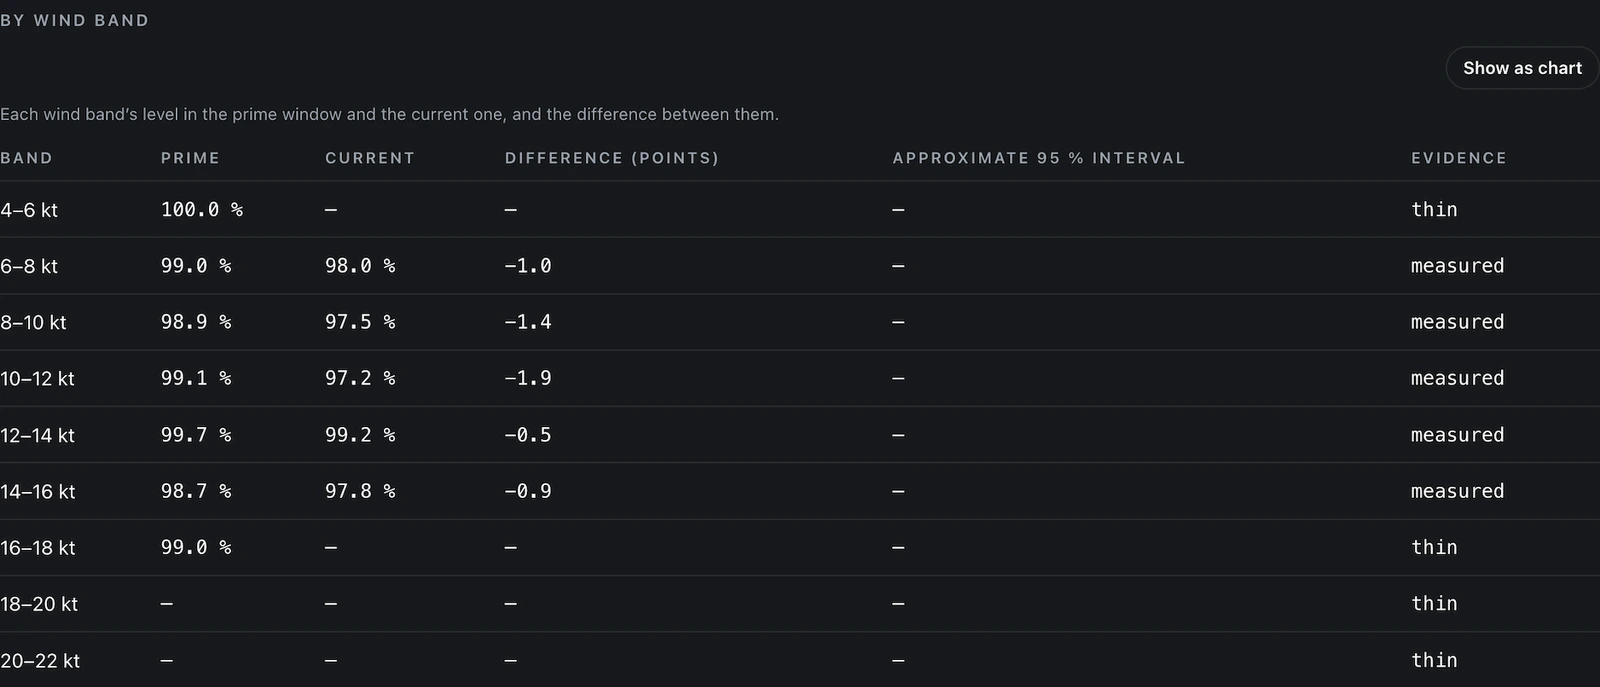
A sail that is up all day cannot be told apart from the day it sailed in. So beside every band the same comparison is made over every sail that flew that band, and where this sail’s difference sits inside that one, the row reads indistinguishable from the boat’s own drift. The change is reported as the boat’s — crew, rig, sea state, a season of improvement — and is not charged to the sail.
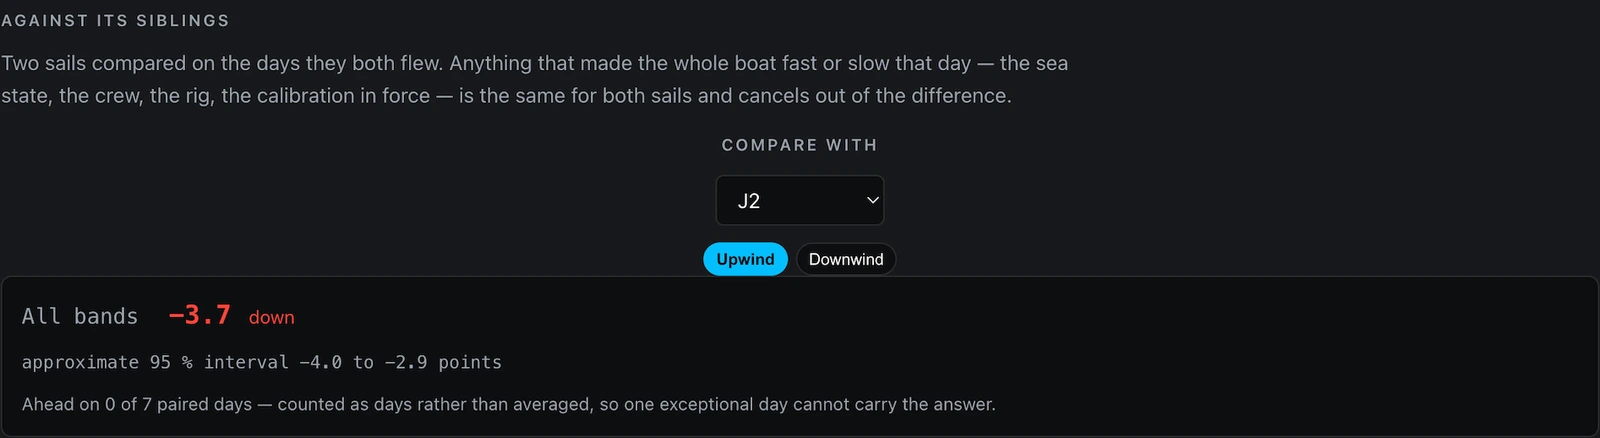
The comparison that settles that case is two sails on the days they both flew. Take the days both were up in the same band, compare them day by day, and whatever made the whole boat fast or slow that day — the sea state, the crew, the rig, the calibration in force — is the same for both and subtracts out. Beside the difference is the count of paired days the first sail was ahead, and every paired day is listed. It needs crossover days: alternating the two sails across one day is what fills it in.
Under the numbers the page prints what they were measured against — which sails were up alongside this one and for how long, how much sailing was dropped for crossing a sail change, which polar and which calibration entries were in force, and what is not modelled. The method is written out in Measuring sail degradation, down to the sixteen limits it carries, and The sails log walks the page itself.
How it works
- Import a file, or stream the day from the boat.
- The preview maps the columns; you commit it.
- Open the race in the debrief player.
- Explorer for the channels, Tuning for the targets — both from the player’s topbar.
- Correct an instrument with a calibration entry.
- The whole season re-reads through it, summaries included.
What it does not do
Calibration never applies anything itself: the platform suggests and a person applies. A per-band error has no single linear entry, so the upwash profile offers no button at all. A named sail has no deviation, so a word cell is never graded. And the sail performance trend models nothing — sea state, crew, rig tune and what else was up at the time are real and unmodelled. A difference with no interval behind it is served as not enough evidence, never as a change.
Common questions
Which telemetry formats can I import?
Expedition race logs and event files as CSV, Vakaros Atlas recordings as .vkx or the Connect CSV export, an NMEA 2000 recording as a zip of a Yacht Devices recorder’s data folder, and a raw NMEA 0183 sentence log. A boat running Race Control streams the day instead, with no file at all.
Does correcting an instrument change my recorded data?
No. A calibration entry is a lens applied when the data is read, at every zoom level and in the precomputed summaries. Your instruments’ readings are kept exactly as they were recorded, and deleting an entry makes everything read as it did before.
Can the platform work out a wind vane offset for me?
It measures one and suggests it; a person applies it. Pick a window of the boat’s own sailing and the analysis reads the tacks in it, using tack symmetry, a wind-axis cross-check and boat speed against SOG. When the error is not a constant it refuses to give a number instead of giving a wrong one.
How is percent of target computed?
Against the boat’s own polar and tuning targets, interpolated at the wind you actually had rather than read off the nearest row. A target cell that is a word — a named sail, for instance — is shown as written and never graded.
Where to read more
- Importing telemetry — The five ways a day of sailing gets in, what each format needs from you, and how the preview, the commit and the status line work.
- Channel mapping — Three kinds of channel name and which is which: the standard registry, your own custom: channels, and whatever your files happen to call things — plus the correction you only make once, the ledger of columns nobody has claimed, and who may change any of it.
- Polars and targets — Giving the boat its numbers: uploading a polar, keeping the tuning tables per mode, importing the team’s own sheet, and what the column chips mean.
- Calibration in practice — Entering a correction, measuring one from your own sailing, reading what Analyze found, applying it — and undoing any of it exactly.
- The sails log — Setting up the wardrobe, letting the tablet fill the log, typing in what it did not record, correcting rows, and reading the two analysis panels.
- Guided calibration — Measuring a wind instrument’s constant angle error from your own sailing — the physics, the algebra, what that constant contains (the mounting offset and the day’s wind shear), and the cross-checks that keep a suggestion accurate.
- The upwash correction table — Correcting a wind-angle error that changes with the breeze: fixed 2-knot bands, half the measured step and never the step, and interpolation that clamps rather than invents.
- The calibration lens — Why a correction is applied when data is read rather than written into it, and the commutation that lets it apply to a whole season instantly.
- Targets and interpolation — Reading the tuning sheet at the wind you actually had: interpolation that clamps rather than extrapolates, settings that step, and how a number is graded.
- Rollups and series — How a season of one-hertz telemetry stays instant: incremental summaries at ingest, circular statistics for angles, and what happens to a summary when data is deleted.
- The sail log — How minutes per sail compute themselves from snapshots, why a missed tap costs one boundary rather than a day, and what the performance trend does and does not claim.
- Measuring sail degradation — Whether a sail has slowed down, and how sure the platform is: VMG against the polar’s best VMG rather than boat speed alone, steady segments conditioned by mode and wind band, day-clustered bootstrap intervals, two sails compared on the same day, and the sixteen limits the method carries.
The rest of the platform
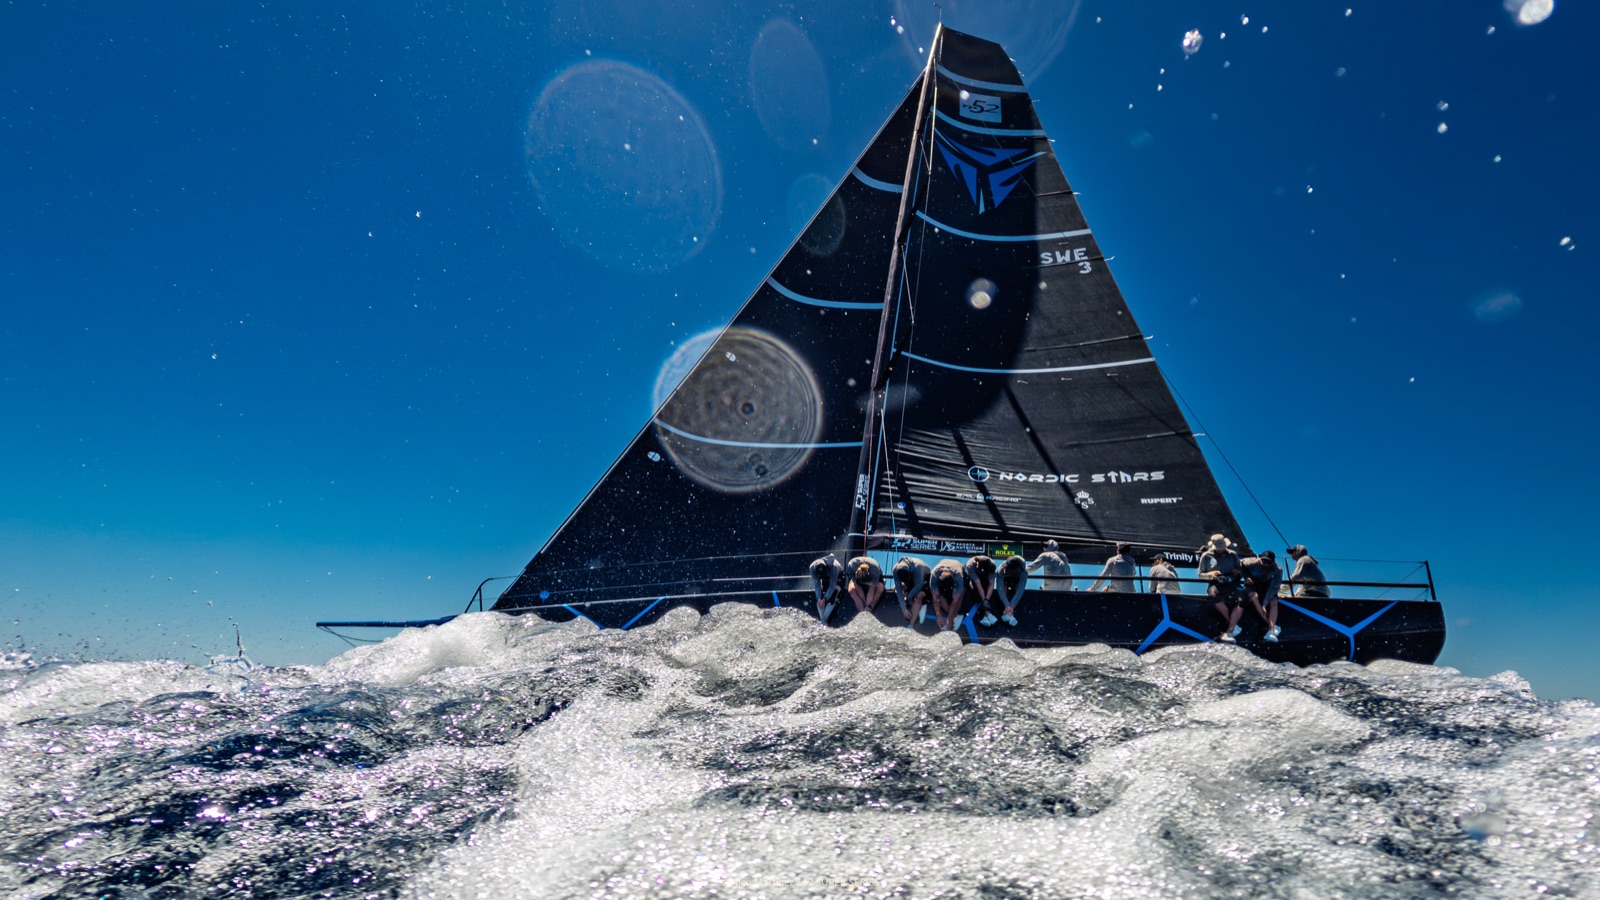
Measure the boat against a number you can defend.
Import a race, correct the instrument, and read the whole season through it. Every account starts with a 30-day free trial for one boat, no card required.