
Where a manoeuvre begins and ends
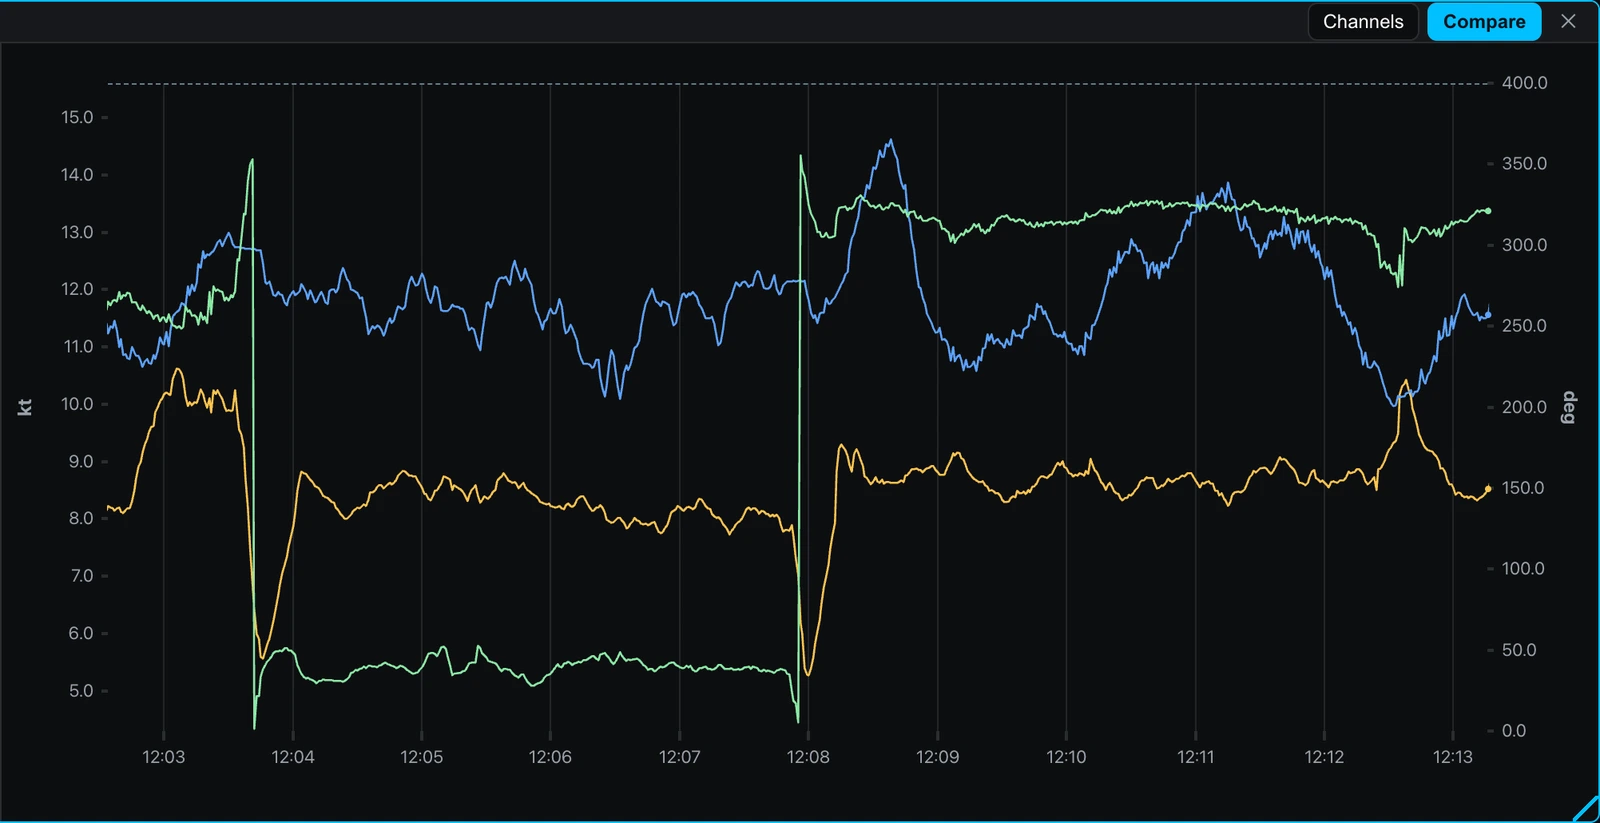
A tack is not an instant. It is the trim and the steering before it, the turn, and the half-minute the boat spends getting back to speed on the new board — so it is found as a transition between two settled states. Close-hauled on port to close-hauled on starboard is a tack; broad reaching on one board to the other is a gybe. Upwind is 25 to 65° of true wind angle and downwind 120 to 175°; under two knots the wind instruments are not measuring sailing at all. The transition has to take under sixty seconds — longer is a boat that stopped sailing and started again — with ten settled seconds either side of it, so a wobble is not counted as two manoeuvres.
It is recorded at the midpoint of that transition, which is as precise as a state-change detector can be: it knows when the boat left one state and when it arrived in the next. That is not the instant three tacks are drawn on top of each other, though — midpoints line up the middles of three turns of different lengths. The moment three tacks genuinely share is the bow passing through the wind.
t = 0 is head to wind on a tack and dead downwind on a gybe. The stored midpoint is never relabelled as it — they are two different times about one manoeuvre, and every figure that aligns curves says on its face which one it used.
What the metres are measured against
The loss is metres of progress to windward given away through the manoeuvre, and what it is compared with is the boat itself, a minute earlier.
Add up, second by second over the minute around the turn, how much less progress the boat was making than it had been making before it started.
Fifteen seconds before t = 0, because a tack begins before the helm goes down; forty-five after, because a boat is not finished tacking when it is back on the new angle — it is finished when it is back at speed. The reference is the median of the run the boat came from rather than its last second: one second before a tack is as likely to be a puff as a trend.
Beside it the report prints the distance through the manoeuvre: the path sailed over the ground across the same window. The two move for different reasons — loss with how slow the turn was and how long the recovery took, distance with how wide it was — so a tack that carries too much speed through head to wind travels further and can still lose less. Where positions were not recorded the column is empty rather than estimated from boat speed and heading, which would be a different measurement wearing the same name.
A loss is not a penalty and not a mistake. Every tack costs something; what this measures is how much, and whether it was more than usual.
The ranking, and the reference over past days
Metres mean little until they are compared with something, and the comparison is this boat’s own best manoeuvres in the same wind speed rather than a manufacturer’s figure: the twentieth percentile of its recorded history of that manoeuvre kind, as a curve against true wind speed.
One tack in five of the ones this boat has already sailed in this breeze was at least this good.
A reference the boat has itself achieved is achievable by construction, and it moves as the crew improves. It is gated on evidence: twelve manoeuvres of that kind across three wind-speed bins before the curve is drawn, and below either gate the target column says so where the number would have been. A twentieth percentile of four tacks is one tack chosen by rounding.
Where the polar comes in, and where it does not
The loss never reads the polar. What reads it is what the report draws beside the loss: the strip labelled boat speed against target, and the path over the ground, coloured by boat speed as a percentage of target all the way round the turn.
That target is taken at the wind of the moment rather than off the nearest row: a polar is indexed by wind speed and angle, so the lookup interpolates across the four grid points around the pair you are standing between, and at the edges of the grid it clamps rather than extrapolating. That rule matters most inside a manoeuvre, where the wind angle sweeps through every value between the two boards — a table that ran a line off the end of its own evidence would invent a target for exactly the seconds a reader came to look at.
The report also names what it cannot separate. A tack in a shift is compared against the reference for the wind speed it was sailed in, not the direction, and one boat’s data cannot tell a slow tack from a header. A second with no value stays a gap in the curve, never a line drawn through it.
What the sheet says it was measured against
Every report prints its yardstick, and on a printed or exported one it is the last sheet: which polar was the reference and in which role, when it was uploaded, how many calibration entries and upwash rows were in force, the version of the computation, and a fingerprint of the telemetry it read.
Corrections apply when data is read rather than when it is stored, so a calibration entry made after the regatta changes the report — which is why the document states which lens it was read through.
Where each of these lives
The manoeuvres report is one of the documents a sailing day offers under Reports, in two halves: tacks, and gybes. They are separate because a gybe turns through nearly twice the angle of a tack and costs several times the metres, and one scale for both flattens every tack against the bottom of it. Each carries the day’s best three aligned on one time axis, the path over the ground, every manoeuvre of the day ranked by the metres it cost, and the shape a manoeuvre makes by wind band. Export as PDF renders the same document on the server, keyed on what the report is made of.
The seconds underneath are in the Explorer, opened from a pill in the debrief player’s topbar: one strip per channel, and a tack drawn as the step it is.
The platform does not compute the tablet’s burn. Race Control carries its own model of what a manoeuvre costs, from tables loaded onto the tablet; the platform stores those tables and serves them back unchanged. The two answer different questions — what will this tack cost in the next ninety seconds, and what did that tack cost — and neither is derived from the other.
Read the method
The documentation this post draws on.
- Manoeuvre loss — What a tack or a gybe costs and how that is measured: where t = 0 sits, the loss integral over the turn, the distance sailed through it, and the boat’s own best in the same wind as the reference.
- Targets and interpolation — Reading the tuning sheet at the wind you actually had: interpolation that clamps rather than extrapolates, settings that step, and how a number is graded.
- Performance trends — How a sailing day becomes a report: steady segments, the three delta-to-target metrics, the smoother and the gate a curve has to pass, the fastest and slowest quartile bands, the season window and the uncertainty band.
- Performance reports — Opening a sailing day as a report: the modes and groupings, the manoeuvres, start and race-legs reports, what every layer of a figure is, what a missing figure says, reading a chart as a table, printing to A4 and exporting a PDF.